
Appendices to the 2014 LBNL cost-of-saved-energy study: history of the metric, the program typology and data glossary, database QA/QC methods, discount-rate selection, levelized CSE tables by sector and program type, and the regression framework.
Work funded by the U.S. Department of Energy and produced by Lawrence Berkeley National Laboratory, reproduced in full with attribution. Original report: The Program Administrator Cost of Saved Energy for Utility Customer-Funded Energy Efficiency Programs (LBNL, March 2014). This document is the report’s Appendices volume.
The Program Administrator Cost of Saved Energy for Utility Customer-Funded Energy Efficiency Programs
APPENDICES
Megan A. Billingsley, Ian M. Hoffman, Elizabeth Stuart, Steven R. Schiller, Charles A. Goldman, Kristina LaCommare
Environmental Energy Technologies Division
March 2014
Ernest Orlando Lawrence Berkeley National Laboratory
The work described in this report was funded by the National Electricity Delivery Division of the U.S. Department of Energy’s Office of Electricity Delivery and Energy Reliability under Lawrence Berkeley National Laboratory Contract No. DE-AC02-05CH11231.
Appendix A: Research into the Costs of Saved Energy
Efforts to quantify the cost of saving energy date to the earliest significant programs in the 1970s. In the latter part of that decade, Arthur Rosenfeld, Amory Lovins and others developed a levelized cost of lifetime energy savings metric, in which costs were amortized over the economic life of efficiency measures. This approach treated measure costs as though they were financed with a loan, with a repayment term equal to the economic life of the measures. The levelized costs of efficiency then could be compared with a utility’s levelized cost of energy from a power plant that also is considered financed. Alan Meier, Janice Wright and Rosenfeld refined those concepts and improved the accounting of costs and savings (Meier et al 1982) in order to construct conservation “supply” curves for individual measures.1
These early calculations of levelized efficiency costs were based strictly on the costs of purchasing and installing more efficient measures. They therefore are best understood as demonstrating technical and economic potential: what measures can deliver what quantity of savings at an incremental measure cost below the price of energy supply?
Once utility programs began to proliferate in the 1980s, however, the reports and impact evaluations of program administrators added a new dimension to understanding the costs of energy efficiency. Utility program data provided insight into what it cost at the time to get customers to take efficiency actions (i.e., the cost of administering programs, identifying and promoting energy saving measures to customers, providing incentives and verifying the savings, among other expenses). The more common cost-performance metrics for program administrators were the costs of first-year and lifetime savings, from the perspective of the utility.
Numerous researchers have noted the incompleteness, uneven consistency and lack of standardization in reported program data (see, e.g., Hirst and Goldman 1989, Joskow and Marrow 1992). The total resource costs of energy efficiency (including both administrator and participant costs), on a $/kilowatt-hour or therm basis, were especially difficult for external analysts to calculate because most utilities either did not have or did not report participant costs (Nadel 1991). Several observers have commented on the challenges that these data gaps impose on fully accounting for the costs of efficiency and comparing energy efficiency with supply-side resources for the purposes of utility planning. Some have suggested that these deficiencies contribute to significantly understating the costs of energy efficiency (Joskow and Marron 1992).
Some efforts were made in the early 1990s to rectify these deficiencies and calculate the full, total resource costs of energy efficiency for comparison with the utility costs of energy supply (Eto et al. 1994, 1995; Goldman and Kito 1995). These efforts required substantial inquiries beyond the reported data, including consultation of financial filings and oral interviews with utility DSM staff, regulators, or energy services companies.
Since then, researchers have tended to rely primarily upon administrator costs of saved energy as the primary metrics of program cost performance. With the exception of several program-level studies (e.g., Joskow and Marron 1992; Eto et al. 1994, 1995, 2000), most recent studies have analyzed and reported the cost of saved energy at the portfolio level or by market sector (e.g. residential, commercial/industrial). In the most recent and largest national studies to date, Friedrich et al. (2009) analyzed utility electricity programs in 14 states, and natural gas programs in seven states, using information from program reports, evaluations, and other sources. This levelized CSE is somewhat lower than reported by other previous studies. In a 2009 study, for example, Friedrich et al. found an average administrator levelized CSE of $0.025/kWh in constant 2007 dollars or $0.027/kWh in constant 2012 dollars—about 29% higher than is reported here. Friedrich et al. used a slightly lower discount rate (5% vs. 6% used in this report), so that the actual difference is larger.
The remaining differences have several possible explanations. The LBNL DSM Program Impacts Database contains a larger sample of program administrators, many of whom may have used longer program measure lifetimes or other assumptions that could affect savings values. A substantial number of the program administrators in the database also operate in states that are relatively new to exploiting energy savings as a resource. Nearly 40% of the electricity program administrators in the database have administered substantial programs for less than four years and so may be early in accessing energy savings in their respective state economies or targeting the least costly savings opportunities first.
The many research efforts detailed above have been useful for indicating overall trends and costs of efficiency. The work also has underscored persistent deficiencies in the reported program data, particularly for calculating the “all-in” or total resource costs of efficiency.
Recently, several organizations have collected information that facilitates analysis of the administrator cost of saved energy using various methods and definitions. These organizations and their efforts include:
- Consortium for Energy Efficiency’s (CEE) annual industry reports. Since 2006, CEE has surveyed efficiency program administrators in order to document the industry’s budgets, expenditures and savings.2
- The Northeast Energy Efficiency Partnerships’ (NEEP) Regional Evaluation, Measurement and Verification Forum (EM&V Forum) supports the development and use of common, consistent protocols to evaluate, measure, verify, and report the savings, costs, and emission impacts of energy efficiency. The EM&V Forum has developed the Regional Energy Efficiency Database (REED), launched in early 2013, which includes data from eight states, soon to be nine states and the District of Columbia. REED was informed by the Forum’s “Common Statewide Energy Efficiency Reporting Guidelines,” which were adopted by the Forum’s Steering Committee in 2010.3
- The American Council for an Energy-Efficient Economy (ACEEE) has conducted industry surveys for many years and, as noted above, multi-state studies in 2004 and 2009 of the cost of energy saved through efficiency programs.
- U.S. Energy Information Agency (EIA) has collected data on energy efficiency programs administered by electric utilities on a voluntary basis for many years through their 861 Form. EIA (2013) has also released a “State Energy Efficiency Program Evaluation Inventory” that supported the National Energy Modeling System (NEMS) and provided information from state-mandated energy efficiency program evaluations.4
Appendix B. Energy Efficiency Program Typology and Data Glossary
In this appendix, we describe and define simplified and detailed program categories for seven sectors: residential; commercial; industrial/agricultural; commercial/industrial; cross-cutting and other; low income; and demand response programs (see Tables B-1 to B-7).5 For each sector, the left hand column of the table lists the detailed program category names, with detailed program definitions in the middle column, while the right-hand column indicates the corresponding simplified program category.6
We also include a glossary of reported data, in which we provide definitions for reporting various types of energy efficiency program data: number of participants, program activity (e.g. number of measures installed, buildings retrofitted), budgets, committed spending, actual expenditures grouped into various categories of program costs, measure lifetimes, and energy savings.
As part of the ongoing LBNL Cost of Saved Energy Project, we intend to solicit input from industry stakeholders and regularly update the program typology and definitions.
| Detailed Category | Detailed Program Definition | Simplified Category |
|---|---|---|
| Behavioral/ Online Audit/ Feedback | Residential programs designed around directly influencing household habits and decision-making on energy consumption through quantitative or graphical feedback on consumption, sometimes accompanied by tips on savings energy. These programs include behavioral feedback programs (in which energy usage reports compare a consumer's household energy usage with those of similar consumers); online audits that are completed by the consumer; and in-home displays that help consumers assess their usage in near real time. This program category does not include on-site energy assessments or audits. | Behavior/ Education |
| Consumer Product Rebate/ Appliances | Programs that incentivize the sale, purchase and installation of appliances (e.g., refrigerators, dishwashers, clothes washers and dryers) that are more efficient than current standards. Appliance recycling and the sale/purchase/installation of HVAC equipment, water heaters and consumer electronics are accounted for separately. | Consumer Product Rebate |
| Consumer Product Rebate/ Electronics | Programs that encourage the availability and purchase/lease of more efficient personal and household electronic devices, including but not limited to televisions, set-top boxes, game consoles, advanced power strips, cordless telephones, PCs and peripherals specifically for home use, chargers for phones/smart phones/tablets. A comprehensive efficiency program to decrease the electricity use of consumer electronics products includes two focuses: product purchase and product use. Yet not every consumer electronics program will seek to be comprehensive. Some programs will embark on ambitious promotions of multiple electronics products, employing upstream, midstream, and downstream strategies with an aggressive marketing and education component. At the other end of the continuum, a program administrator may choose to focus exclusively on consumer education. | |
| Consumer Product Rebate/Lighting | Programs aimed specifically at encouraging the sale/purchase and installation of more efficient lighting in the home. These programs range widely from point-of-sale rebates to CFL mailings or giveaways. Measures tend to be CFLs, fluorescent fixtures, LED lamps, LED fixtures, LED holiday lights and lighting controls, including occupancy monitors/switches. | |
| Appliance Recycling | Programs designed to remove less efficient appliances (typically refrigerators and freezers) from households. | |
| Multi-Family | Multi-family programs are designed to encourage the installation of energy efficient measures in common areas, units or both for residential structures of more than four units. These programs may be aimed at building owners/managers, tenants or both. | Multi Family |
| New Construction | Programs that provide incentives and possibly technical services to ensure new homes are built or manufactured to energy performance standards higher than applicable code (e.g., ENERGY STAR Homes). These programs include new multi-family and new/replacement mobile homes. | New Construction |
| HVAC | Programs designed to encourage the distribution, sale/purchase, proper sizing and installation of HVAC systems that are more efficient than current standards. Programs tend to support activities that focus on central air conditioners, air source heat pumps, ground source heat pumps, and ductless systems that are more efficient than current energy performance standards, as well as climate controls and the promotion of quality installation and quality maintenance. | Prescriptive |
| Insulation | Programs designed to encourage the sale/purchase and installation of insulation in residential structures, often through per-square-foot incentives for insulation of specific R-values versus an existing baseline. Programs may be point-of-sale rebates or rebates to insulation installation contractors. | |
| Pool Pump | Programs that incentivize the installation of higher efficiency or variable speed pumps and controls, such as timers, for swimming pools. | |
| Prescriptive | Residential programs that provide or incentivize a set of pre-approved measures not included in, or distinguishable from, the other residential program categories (e.g., direct install, HVAC, lighting). For example, if a residential program features rebates for a large set of mixed, pre-approved offerings (e.g., insulation, HVAC, appliances, lighting), yet the relative contribution of each measure to program savings is unclear or no single measure accounts for a large majority of the savings, then the program should be classified as a residential prescriptive program. | |
| Water Heater | Programs designed to encourage the distribution, sale/purchase and installation of electric and/or gas water-heating systems that are more efficient than current standards, including high efficiency water storage tank and tankless systems. | |
| Windows | Programs designed to encourage the sale/purchase and installation of efficient windows in residential structures. | |
| Whole Home/ Direct Install | Direct-install programs provide a set of pre-approved measures that may be installed at the time of a visit to the customer premises or provided as a kit to the consumer, usually at modest or no cost to the consumer and sometimes accompanied by a rebate. Typical measures include CFLs, low-flow showerheads, faucet aerators, water-heater wrap and weather stripping. Such programs may also include a basic, walk-through energy assessment or audit, but the savings are principally derived from the installation of the provided measures. Education programs that supply kits by sending them home with school children are not included in this program category; they are classified as education programs. | Whole Home Upgrade (Incl. audits, retrofits, etc.) |
| Whole Home/ Audits | Residential audit programs provide a comprehensive, standalone assessment of a home's energy consumption and identification of opportunities to save energy. The scope of the audit includes the whole home although the thoroughness and completeness of the audit may vary widely from a modest examination and simple engineering-based modeling of the physical structure to a highly detailed inspection of all spaces, testing for air leakage/exchange rates, testing for HVAC duct leakage and highly resolved modeling of the physical structure with benchmarking to customer utility bills. | |
| Whole Home/ Retrofit | Whole-home energy upgrade or retrofit programs combine a comprehensive energy assessment or audit that identifies energy savings opportunities with house-wide improvements in air sealing, insulation and, often, HVAC systems and other end uses. The HVAC improvements may range from duct sealing to a tune up to full replacement of the HVAC systems. Whole-home programs are designed to address a wide variety of individual measures and building systems, including but not limited to: HVAC equipment, thermostats, furnaces, boilers, heat pumps, water heaters, fans, air sealing, insulation (attic, wall, and basement), windows, doors, skylights, lighting, and appliances. As a result, whole-home programs generally involve one or more rebates for multiple measures. Whole-home programs generally come in two types: comprehensive programs that are broad in scope and less comprehensive, prescriptive programs sometimes referred to as "bundled efficiency" programs. This category addresses all of the former and most of the latter, but it excludes direct-install programs that are accounted for separately. | |
| Financing | Programs designed to provide or facilitate loans, credit enhancements or interest rate reductions/buy downs. As with other programs, included costs are utility costs, including the costs of any inducements for lenders, e.g., loan loss reserves, interest rate buy-downs, etc. Where participant costs are available for collection, these ideally will include the total customer share, i.e., both principal (the participant payment to purchase and install measures) and interest on that debt. Most of these programs will be directed toward enhancing credit or financing for residential structures. | All Other Residential |
| Other | Programs designed to encourage investment in energy efficiency activities in residences but are so highly aggregated (e.g., Existing Homes programs that include retrofits, appliances, equipment, etc.) and undifferentiated that they cannot be sorted into the residential program categories that are detailed in this document. |
| Detailed Category | Detailed Program Definition | Simplified Category |
|---|---|---|
| Audit | Programs in which an energy assessment is performed on one or more participant commercial facilities to identify sources of potential energy waste and measures to reduce that waste. | Custom |
| Custom | Programs designed around the delivery of site-specific projects typically characterized by an extensive onsite energy assessment and identification and installation of multiple measures unique to that facility. These measures may vary significantly from site to site. This category is intended to capture "whole-building" approaches to commercial sector efficiency opportunities for a wide range of building types and markets (e.g., office, retail) and wide range of measures. | |
| Commissioning/Retro-Commissioning | Programs aimed at diagnosing energy consumption in a commercial facility and optimizing its operations to minimize energy waste. Such programs may include installation of certain measures (e.g., occupancy monitors and switches), but program activities tend to be characterized more by tuning or retuning, coordinating and testing the operation of existing end uses, systems and equipment for energy efficient operation. The construction of new commercial/industrial facilities that includes energy performance commissioning should be categorized as "Com: New Construction". The de novo installation of energy management systems with accompanying sensors, monitors and switches is regarded as a major capital investment and should be categorized under "Com: Custom". | |
| Govt./Nonprofit/MUSH | MUSH (Municipal, University, School & Hospital) and government and nonprofit programs cover a broad swath of program types generally aimed at public and institutional facilities and which include a wide range of measures. Programs which focus on specific technologies (e.g., HVAC and lighting) have their own commercial program categories Examples include incentives and/or technical assistance to promote energy efficiency upgrades for elementary schools, recreation halls and homeless shelters. Street lighting is accounted for as a separate program category. | MUSH & Govt. |
| Street Lighting | Street lighting programs include incentives and/or technical support for the installation of higher efficiency street lighting and traffic lights than the current baseline. | |
| New Construction | Programs that incentivize owners or builders of new commercial facilities to design and build beyond current code or to a certain certification level (e.g., ENERGY STAR or LEED). | New Construction |
| HVAC | C&I HVAC programs encourage the sale/purchase and installation of heating, cooling and/or ventilation systems at higher efficiency than current energy performance standards, across a broad range of unit sizes and configurations. Most of these programs will be directed toward commercial structures. | Prescriptive |
| Lighting | C&I lighting programs incentivize the installation of efficient lighting and lighting controls. Typical measures might include T-8/T-5 fluorescent lamps and fixtures; CFLs and fixtures; LEDs for lighting, displays, signs and refrigerated lighting; metal halide and ceramic lamps and fixtures; occupancy controls; daylight dimming; and timers. | |
| Performance Contracting/ DSM Bidding | Programs that incentivize or otherwise encourage energy services companies (ESCOs) and participants to perform energy efficiency projects, usually under an energy performance contract (EPC), a standard offer or other arrangement that involves ESCOs or customers offering a quantity of energy savings in response to a competitive solicitation/bidding process with compensation linked to achieved savings. | |
| Prescriptive/IT & Office Equipment | Programs aimed at improving the efficiency of office equipment, chiefly commercially available PCs, printers, monitors, networking devices and mainframes not rising to the scale of a server farm or floor. | |
| Prescriptive/ Grocery | Grocery programs are prescriptive programs aimed at supermarkets and are usually designed around indoor and outdoor lighting and refrigerated display cases. | |
| Other | Prescriptive programs that encourage the purchase and installation of some or all of a specified set of pre-approved measures besides those covered in other measure-specific prescriptive programs (e.g., HVAC and Lighting). | |
| Custom | Custom programs applied to small commercial facilities. (See definition of custom programs for additional detail.) | Small Commercial |
| Prescriptive | Prescriptive programs applied to small commercial facilities. (See definition of prescriptive programs for additional detail.) Such programs may range from a walk-through audit and direct installation of a few pre-approved measures to a fuller audit and a fuller package of measures. Audit only programs have their own category. | |
| Financing | Programs designed to provide or facilitate loans, credit enhancements or interest rate reductions/buy downs. As with other programs, included costs are utility costs, including the costs of any inducements for lenders, e.g., loan loss reserves, interest rate buy-downs, etc. Where participant costs are available for collection, these ideally will include the total customer share, i.e., both principal (the participant payment to purchase and install measures) and interest on that debt. Most of these programs will be directed toward enhancing credit or financing for commercial structures. | All Other Commercial |
| Other | Programs not captured by any of the specific commercial program categories but are sufficiently distinct to the commercial sector to not be treated as a "Commercial/Industrial Other" program. Example: An EE program aimed specifically at the commercial subsector but is not clearly prescriptive or custom in nature. |
| Detailed Category | Detailed Program Definition | Simplified Category |
|---|---|---|
| Audit | Programs in which an energy assessment is performed on one or more participant industrial or agricultural facilities to identify sources of potential energy waste and measures to reduce that waste. | Custom |
| Custom | Programs designed around the delivery of site-specific projects typically characterized by an extensive onsite energy assessment and identification and installation of multiple measures unique to that facility. These measures may vary significantly from site to site. This category is intended to capture "whole-facility" approaches to industrial or agricultural sector efficiency opportunities for a wide range of building types and markets | |
| Custom/ Data Centers | Data center programs are custom-designed around large-scale server floors or data centers that often serve high-tech, banking or academia. Projects tend to be site-specific and involve some combination of lighting, servers, networking devices, cooling/chillers, and energy management systems/software. Several of these may be of experimental or proprietary design. | |
| Custom/Ind. & Ag. Process | Industrial programs deliver custom-designed projects that are characterized by an onsite energy and process efficiency assessment and a site-specific measure set focused on process related improvements that may include, for example, substantial changes in a manufacturing line. This category includes all EE program work at industrial or agricultural sites that is process focused and not generic (and thus would be in the custom category) and not otherwise covered by the single-measure prescriptive programs below (e.g., lighting, HVAC, water heaters). | |
| Custom/ Refrigerated Warehouses | Warehouse programs are typically aimed at large-scale refrigerated storage facilities and often target end uses such as lighting, climate controls and refrigeration systems. | |
| New Construction | Programs that incentivize owners or builders of new industrial or agricultural facilities to design and build beyond current code or to a certain certification level, e.g., ENERGY STAR or LEED. | New Construction |
| Prescriptive Industrial | Prescriptive programs that encourage the purchase and installation of some or all of a specified set of pre-approved industrial measures besides those covered in other measure-specific prescriptive programs on this list, e.g., industrial compressor programs. | Prescriptive |
| Prescriptive/ Agriculture | Farm- and orchard-based agricultural programs that primarily involve irrigation pumping and do not include agricultural refrigeration or processing at scale. | |
| Prescriptive/ Motors | Motors programs usually offer a prescribed set of approved higher efficiency motors, with industrial motors programs typically getting the largest savings from larger, high powered motors (>200 hp). | |
| Financing | Programs designed to provide or facilitate loans, credit enhancements or interest rate reductions/buy downs. As with other programs, included costs are utility costs, including the costs of any inducements for lenders, e.g., loan loss reserves, interest rate buy-downs, etc. Where participant costs are available for collection, these ideally will include the total customer share, i.e., both principal (the participant payment to purchase and install measures) and interest on that debt. Most of these programs will be directed toward enhancing credit or financing for industrial and/or agricultural facilities. | All Other IA |
| Self Direct | Industrial programs that are designed and delivered by the participant, using funds that otherwise would have been paid as ratepayer support for all DSM programs. These programs may be referred to as "opt out" programs, among other names. | |
| Other | Programs not captured by any of the specific industrial/agricultural categories but are sufficiently distinct to the industrial and/or agricultural sectors to not be treated as a "Commercial/Industrial Other" program. Example: An efficiency program aimed specifically at the industrial and agricultural sectors but is not clearly prescriptive or custom in nature might be classified as Other |
Table B-4 includes program categories and definitions for those commercial and industrial programs that were highly aggregated to target all C&I markets and, based upon the limits of the reported data, could not be characterized as obtaining the large majority of their savings from either the commercial or industrial sector.
| Detailed Category | Detailed Program Definition | Simplified Category |
|---|---|---|
| Custom | Programs designed around the delivery of site-specific industrial and commercial projects typically characterized by an extensive onsite energy assessment and identification and installation of multiple measures unique to that facility. This category is for programs that address both the commercial and industrial sectors and cannot be relegated to one sector or another for lack of information on participation or savings. | Custom |
| New Construction | Programs that incentivize owners or builders of new commercial and industrial facilities to design and build beyond current code or to a certain certification level, e.g., ENERGY STAR or LEED. This category should be used sparingly for those programs that cannot be identified with either the commercial or industrial sector on the basis of information available about participation or the source(s) of savings. | New Construction |
| Prescriptive | Prescriptive programs that encourage the purchase and installation of some or all of a specified set of pre-approved industrial and/or commercial measures but which cannot be differentiated by sector based upon the description of the participants or nature or source of the savings. | Prescriptive |
| Self Direct | Generally large commercial and industrial programs that are designed and delivered by the participant, using funds that otherwise would have been paid as ratepayer support for all DSM programs. This category is to be used for self-direct or opt-out programs that address both large commercial and industrial entities but which cannot be differentiated between these sectors because the nature and source of the savings is not available or is also too highly aggregated. | All Other C&I |
| Mixed Offerings | Programs that cannot be classified under any of the specific commercial or industrial program categories and span a large variety of offerings aimed at both the commercial and industrial sectors. | |
| Other | Programs not captured by any of the specific commercial/industrial categories but are sufficiently distinct to the industrial and/or agricultural sectors to not be treated as a "Commercial/Industrial Other" program |
| Detailed Category | Detailed Program Definition | Simplified Category |
|---|---|---|
| Codes & Standards (C&S) | In C&S programs, the program administrator may engage in a variety of activities designed to advance the adoption, application or compliance level of building codes and end-use energy performance standards. Examples might include advocacy at the state or federal level for higher standards for HVAC equipment; training of architects, engineers and builder/developers on code compliance; and training of building inspectors in ensuring the codes are met. | Codes & Standards |
| Market Transformation (MT) | Programs that encourage a reduction in market barriers resulting from a market intervention, as evidenced by a set of market effects that is likely to last after the intervention has been withdrawn, reduced, or changed. MT programs are gauged by their market effects (e.g., increased awareness of energy efficient technologies among customers and suppliers); reduced prices for more efficient models; increased availability of more efficient models; and ultimately, increased market share for energy efficient goods, services and design practices. Example programs might include upstream incentives to manufacturers to make more efficient goods more commercially available; and point-of-sale or installation incentives for emerging technologies that are not yet cost effective. Workforce training and development programs are covered by a separate category. Upstream incentives for commercially available goods are sorted into the program categories for those goods (e.g., consumer electronics or HVAC). | Market Transformation |
| Workforce Development | Workforce training and development programs are a distinct category of market transformation program designed to provide the underlying skills and labor base for deployment of energy-efficiency measures. | |
| Marketing, Education, Outreach (ME&O) | ME&O programs include most standalone marketing, education and outreach programs (e.g., statewide marketing, outreach and brand development). In-school energy and water efficiency programs are also included in this category, including those that supply school children with kits of prescriptive measures such as CFLs and low-flow showerheads for installation at home. | Marketing, Education, Outreach |
| Other | This category is intended to capture all programs that cannot be allocated to a specific sector (or are multi-sectoral) and cannot be allocated to a specific program type. | Multi-Sector and Other |
| Planning/ Evaluation/ Other Programmatic Support | Non-ME&O support programs include the range of activities not otherwise accounted for in program-specific costs but needed for planning & designing a portfolio of programs and otherwise complying with regulatory requirements for DSM activities outside of program implementation. These activities generally are focused on the front and back end of program cycles, in assessing prospective programs; designing programs and portfolios; assessing the cost effectiveness of measures, programs and portfolios; and arranging for, directing or delivering reports and evaluations of the process and impacts of those programs - where those costs are not captured in program costs. | |
| Voltage Reduction/Transformers | Programs that support investments in distribution system efficiency or enhance distribution system operations by reducing losses. The most common form of these programs involve the installation and use of conservation voltage regulation/reduction (CVR) or optimization systems and practices that control distribution feeder voltage so that utilization devices operate at their peak efficiency, which is usually at a level near the lower bounds of their utilization or nameplate voltages. Other measures may include installation of higher efficiency transformers. These programs generally are not targeted to specific end users but typically involve changes made by the electricity distribution utility. | |
| Shading/ Cool Roofs | Shading/reflective programs include programs designed to lessen heating and cooling loads through changes to the exterior of a structure (e.g., tree plantings to shade walls and windows, window screens and cool/reflective roofs). These programs are not necessarily specific to a sector. | |
| Multi-Sector Rebates | Multi-sector rebate programs include providing incentives for commercially available end-use goods for multiple sectors (e.g., PCs, HVAC). | |
| Research | These programs are aimed generally at helping the program administrator identify new opportunities for energy savings (e.g., research on emerging technologies or conservation strategies). Research conducted on new program types or the inclusion of new, commercially available measures in an existing program are accounted for separately under cross-cutting program support. | Research |
| Detailed Category | Detailed Program Definition | Simplified Category |
|---|---|---|
| Low Income | Low-income programs are efficiency programs aimed at lower income households, based upon some type of income/means testing or eligibility. These programs most often take the form of single-family weatherization, but a variety of other program types also are included in this program category (e.g., multi-family/affordable housing weatherization, low-income direct-install programs). | Low Income |
Table B-7 includes program categories for demand-response programs. These categories were included chiefly to enable the Consortium for Energy Efficiency, which shares the program categories with LBNL, to collect demand-response spending and savings data and to enable LBNL to include demand-response data in the future. At this time, however, demand-response programs have not been collected and integrated into the LBNL database.
| Detailed Category | Detailed Program Definition | Simplified Category |
|---|---|---|
| Time-of-Use Pricing | Demand-side management that uses a retail rate or Tariff in which customers are charged different prices for using electricity at different times during the day. Examples are time-of-use rates, real time pricing, hourly pricing, and critical peak pricing. Time-based rates do not include seasonal rates, inverted block, or declining block rates. | Pricing |
| Critical Peak Pricing | Demand-side management that combines direct load control with a pre-specified high price for use during designated critical peak periods, triggered by system contingencies or high wholesale market prices. | |
| Critical Peak Pricing with Load Control | Demand-side management that combines direct load control with a pre-specified high price for use during designated critical peak periods, triggered by system contingencies or high wholesale market prices. | |
| Real-Time Pricing | Demand-side management that uses rate and price structure in which the retail price for electricity typically fluctuates hourly or more often, to reflect changes in the wholesale price of electricity on either a day-ahead or hour-ahead basis. | |
| Peak Time Rebate | Peak time rebates allow customers to earn a rebate by reducing energy use from a baseline during a specified number of hours on critical peak days. Like Critical Peak Pricing, the number of critical peak days is usually capped for a calendar year and is linked to conditions such as system reliability concerns or very high supply prices. | Rebate |
| Other | Load management programs that are not captured by the specific DR categories named on this list. | Other |
Program Data Glossary
# Participants: Total number of consumers participating in the subject program. For new construction programs, we classify "number of homes or buildings" as the number of participants. In some programs, the number of participants will be the number of structures or multifamily units that received efficiency measures through a program.
# Units: Total number of measures installed or credited with savings in the subject program (e.g., number of CFLs for which savings are claimed in a lighting program). If the number of units reported for a new construction or retrofit program is defined as structures built or retrofitted to a higher level of energy performance, then these are not counted as units but as participants.
Administration Costs ($): Actual spending by the program administrator on costs associated with planning, designing and implementing an energy efficiency program in a defined geographic area, unless some of those costs are specifically accounted for elsewhere. In general, these costs pay for the salaries, training and equipping of internal program administrator staff to administer and implement a program or oversee the work of an outside contract implementer. If evaluation, compliance and marketing, outreach & education costs are not reported separately, then they typically are included under program administration costs. When a program is being terminated, shut-down costs also should be included in administration costs.
Annual Incremental Savings: Annual incremental savings are the savings acquired or planned to be acquired as a result of energy efficiency activities in that program year. Note that these are annualized, "full-year" savings, regardless of when measures were installed during the program year; the cost of first-year savings is derived for a full, 12-month first year.
Average Measure Lifetime (Years): Average measure lifetime is the weighted average economic lifetime of all measures installed in a program year.
Detailed Program Categorization: One of about 70 unique and specific program categories described in detail in the Detailed Program Category Definitions.
Evaluation Costs ($): Evaluation costs are program administrator spending on any form of Evaluation, Measurement & Verification (EM&V) activity, whether internal, external or pass-through funding for regulator-guided EM&V. EM&V includes impact and process evaluations and may include an allocation of portfolio-level EM&V down to each program.
Gross Savings: Gross savings are the change in energy consumption that results directly from program-related actions taken by participants in an energy efficiency program, regardless of why they participated.
Lifetime Electric Gross Savings (GWh): The expected gross electricity savings over the lifetime of the measures installed as part of the subject program. For the purposes of this collection effort, these values are reported by the program administrator.
Lifetime Electric Net Savings (GWH): The expected net electricity savings over the lifetime of the measures installed as part of the subject program. These savings may be calculated by multiplying the annual energy use reduction associated with those measures by the lifetime of the measures. For the purposes of this collection effort, these values are reported by the program administrator.
Lifetime Gas Gross Savings (therm): The expected gross natural gas savings over the lifetime of the measures installed as part of the subject program.
Lifetime Gas Net Savings (therm): The expected net natural gas savings over the lifetime of the measures installed as part of the subject program.
Marketing/Education/Outreach Costs ($): Marketing, Education & Outreach (ME&O) costs are actual program administrator spending on efforts to gain access to potential participants (e.g., through recruitment of community leaders), the promotion of a program or the education of participants in conservation/efficiency behaviors as a part of a program. Note that in some cases, program administrators treat ME&O as its own program or may have a separate statewide ME&O effort that is not program specific and addresses branding for the program administrator or portfolio of programs.
Market Sector: Market sector is the segment of the economy that is the source for most of the acquired savings of the program.
Net Savings: Net savings are the change in energy consumption that is attributable to a particular energy efficiency program. This change in energy use and/or demand typically includes some consideration of free riders but also may include, implicitly or explicitly, consideration of participant and non-participant spillover and induced market effects. These factors may be considered in how a baseline is defined (e.g., common practice) and/or in adjustments to gross savings values.
Other Costs ($): Other costs include those categories of spending that may not fit well into the other categories (i.e., are not administration, incentives, ME&O or evaluation costs).
Participant Costs ($): Participant costs are the spending by program participants who receive incentives, technical assistance, product installations, training, energy efficiency information or other services, or items from a program in a given program year. These participant costs are the participant share of the costs of a measure installation or project; they may also take the form of fees. In the case of financed projects, they should include principle and interest.
Participant Incentive Costs ($): Actual spending by the program administrator on financial strategies intended to encourage a change in behavior related to energy use. Incentives can take various forms, e.g., rebates, subsidies, financing, prizes. Customer incentives are commonly used in energy efficiency programs as rebates for individual measures or as buy-downs in more custom-oriented projects, although incentives can be monetary inducements to manufacturers, distributors, contractors, or retailers to increase the availability and affordability of energy efficient goods and services in the market.
Program Administrator Name: Name of the entity that administers the energy efficiency programs for which the data is provided. These entities include utilities; energy efficiency and clean energy utilities (e.g., the District of Columbia’s Sustainable Energy Utility); hybrid governmental/quasi-governmental/third-party administrators agencies (e.g., NYSERDA); and non-profit and for-profit third-party administrators (e.g., Hawaii Energy).
Program Name: Name of the program as used in the report or evaluation.
Resource Program: A resource program is a program intended and designed for directly acquiring energy savings.
Simplified Program Categorization: One of about 30 general program categories that represent a higher level of aggregation among programs and a lower level than market sector. In general, simplified program categories are characterized by a more detailed breakdown of sector ( e.g., Residential) vs. C&I) an indication of whether the program targets individual measures or comprehensive set of measures, and prescriptive versus custom in its design.
Total Claimed Gross Annual Electric Savings (KWh): Gross annual incremental electricity savings as reported by an implementer or administrator, using their own staff and/or an evaluation consulting firm, after the subject energy efficiency activities have been completed in the defined geographic area (e.g., a utility territory within a state).
Total Claimed Gross Annual Gas Savings (therm): Gross annual incremental natural gas savings as reported by an implementer or administrator after the subject energy efficiency activities have been completed.
Total Claimed Net Annual Electric Savings (KWh): Net annual incremental electricity savings as reported by an implementer or administrator after the subject energy efficiency activities have been completed in the defined geographic area (e.g., a utility territory within a state).
Total Claimed Net Annual Gas Savings (therm): Net annual incremental natural gas savings as reported by an implementer or administrator.
Total Electric Budget ($): Total dollar amount that a program administrator budgeted or was projected to spend on an electric energy efficiency program over the defined program year in the defined geographic area where the program is to be implemented. The total program budget includes all program administrative costs, incentive costs, marketing & outreach costs and evaluation costs. Performance incentives are not considered part of the program budget and should be excluded.
Total Electric Committed Spending ($): Total electric committed spending is program spending associated with measures and projects that are approved, contracted and often implemented during the program year but the actual outlay (e.g., payment of a rebate after installation) occurs after the program year has ended.
Total Electric Expenditures ($): Total dollar amount that a program administrator actually spent on an electric energy efficiency program over the defined program year in the defined geographic area where the program is implemented. Total program expenditures include all program administrative costs, incentive costs, marketing & outreach costs and evaluation costs. Performance incentives are not considered part of the program costs and should be excluded.
Total Gas Budget ($): Total dollar amount that a program administrator plans to spend on a natural gas energy efficiency program over the defined program year in the defined geographic area where the program is to be implemented. The total program budget includes all program administrative costs, incentive costs, marketing & outreach costs and, often, evaluation costs. Performance incentives are not considered part of the program budget and should be excluded.
Total Gas Committed Spending ($): Total gas committed spending is program spending associated with measures and projects that are approved, contracted and often implemented during the program year but the actual outlay, e.g., payment of a rebate after installation, occurs after the program year has ended.
Total Gas Expenditures ($): Total dollar amount that a program administrator actually spends on a natural gas energy efficiency program over the defined program year in the defined geographic area where the program is implemented. Total program expenditures include all program administrative costs, incentive costs, marketing & outreach costs and, often, evaluation costs. Performance incentives are not considered part of the program costs and should be excluded.
Total Projected Gross Annual Electricity Savings (KWh): Gross annual incremental electricity savings as estimated by an implementer or administrator before the subject energy efficiency activities have been implemented. Projected savings are typically estimates prepared for program/portfolio design and planning purposes, based in turn upon estimates made before the program year begins of such factors as per-unit savings values, operating hours, installation rates, and savings persistence rates.
Total Projected Gross Annual Gas Savings (therm): Gross annual incremental gas savings as estimated by an implementer or administrator before the subject energy efficiency activities have been implemented. Projected savings are typically estimates prepared for program/portfolio design and planning purposes, based in turn upon estimates made before the program year begins of such factors as per-unit savings values, operating hours, installation rates, and savings persistence rates.
Total Projected Net Annual Electricity Savings (KWh): Net annual incremental electricity savings as estimated by an implementer or administrator before the subject energy efficiency activities have been implemented. Projected savings are typically estimates prepared for program/portfolio design and planning purposes, based in turn upon estimates made before the program year begins of such factors as per-unit savings values, operating hours, installation rates, and savings persistence rates.
Total Verified Gross Annual Electricity Savings (KWh): Annual incremental gross electricity savings estimates are generated by an independent, third-party evaluator after the subject energy efficiency activities have been implemented and an impact evaluation has been completed in the defined geographic area (e.g., a utility territory within a state).
Total Verified Gross Annual Gas Savings (therm): Annual incremental gross natural gas savings estimates are generated by an independent, third-party evaluator after the subject energy efficiency activities in a specific geographic area (e.g., a utility territory within a state) have been implemented and an impact evaluation has been completed.
Total Verified Net Annual Electricity Savings (KWh): Annual incremental net electricity savings estimates are generated by an independent, third-party evaluator after the subject energy efficiency activities have been implemented and an impact evaluation has been completed.
Total Verified Net Annual Gas Savings (therm): Annual incremental net natural gas savings estimates are generated by an independent, third-party evaluator after the subject energy efficiency activities have been implemented and an impact evaluation has been completed.
Appendix C: LBNL DSM Program Impacts Database and Quality Assurance/Control Approach
This appendix provides information about the program cost and savings data that were collected by LBNL for this research effort based on annual reports and evaluations filed by program administrators, how LBNL organized that information in the LBNL DSM Program Impacts Database, and the quality assurance/control processes that LBNL utilized in order to compile program data in a consistent fashion.
Data Collection
Table C-1 provides a summary of the number of program administrators that reported various types of savings data (e.g., gross vs. net, projected, claimed or verified), estimated measure lifetimes for programs, and participation data for their programs. Over 95% of program administrators reported gross annual claimed electricity or natural gas savings. However, less than half of the program administrators reported projected annual savings or verified savings. Less than 60% of administrators reported claimed lifetime gross electricity or gas savings.
Table C-2 provides a summary of the number of program administrators that reported information on program costs (e.g. budgets, actual expenditures, committed expenditures) by cost category (e.g., administration/management costs, customer incentive costs, education/marketing/outreach costs) for each of the program years 2009-2011. Up to 60% of program administrators provided some disaggregation of program costs into various cost categories. Based on the comprehensiveness of administrator’s reporting of various data fields, this initial report relies primarily on total program administrator costs, gross savings, and in the cases of combined gas and electricity efficiency programs, only data for those programs where costs could be allocated to electricity or natural gas savings.
Program Impacts Database Development
The LBNL DSM Program Impacts Database is structured as an Excel spreadsheet in which each row contains all of the program cost and savings data associated with an individual program for a specific year. We manually entered program data for the data fields described in Table C-1 and Table C-2 for each administrator from one or more annual reporting documents.7 Each program was given a unique alphanumeric identifier in the database, and further organized by state, program administrator and program year. Programs that were implemented over multiple years were matched and coded as a series to enable time series analysis.
We reviewed and then classified and assigned programs based on the detailed program categorization (see program typology in Appendix B). Where program names did not obviously indicate the appropriate program category, we reviewed the program narratives, which most often provided enough information to make a clear choice of category. For programs that included a wide range of activity or otherwise did not break neatly into one of the desired program category or sectors, we reviewed the detailed program results for an indication of where the bulk of savings came from and categorized accordingly. Where that information was not available, we categorized the program in the sector-specific “other” category or in the cross-cutting category as applicable. For example, a residential program that included a broad range of sub-program activities such as education, appliances and retrofits was categorized under Residential Other.
| Metric | PAs that Report Electric Values | PAs that Report Gas Values | ||
|---|---|---|---|---|
| Number of PAs Reporting this Data | Percentage of PAs that reported this data | Number of PAs Reporting this Data | Percentage of PAs that reported this data | |
| Average measure lifetime (yrs.) | 23 | 26% | 15 | 30% |
| Claimed Lifetime Gross Savings | 39 | 44% | 29 | 58% |
| Claimed Lifetime Net Savings | 20 | 23% | 18 | 36% |
| Claimed Gross Annual Savings* | 86 | 98% | 48 | 96% |
| Evaluated Gross Annual Savings | 24 | 27% | 7 | 14% |
| Projected Gross Annual Savings | 47 | 53% | 17 | 34% |
| Claimed Net Annual Savings | 45 | 51% | 35 | 70% |
| Evaluated Net Annual Savings | 17 | 19% | 12 | 24% |
| Projected Net Annual Savings | 19 | 22% | 19 | 38% |
| Program Participation (# of Participants ) | 75 | 85% | 22 | 44% |
| Program Participation (# of equipment units) | 36 | 41% | 15 | 30% |
NOTE: A PA is counted as reporting a value if at least one of the programs has that data reported. Not all PAs report the same data for every program. I.e. sometimes measure lifetime is only reported for a few programs but not all.
* In some cases, where the PA only provided net values, we were able to track down net to gross values and calculate Gross values. This count includes those PAs.
| Metric | PAs that Report Electric Values | PAs that Report Gas Values | ||
|---|---|---|---|---|
| Number of PAs Reporting this Data | Percentage of PAs that reported this data | Number of PAs Reporting this Data | Percentage of PAs that reported this data | |
| Total Administrator Program Costs | ||||
| Total Electric Budget | 53 | 60% | N/A | N/A |
| Total Electric Expenditures | 84 | 95% | N/A | N/A |
| Total Electric Committed[1] | 11 | 13% | N/A | N/A |
| Total Gas Budget | N/A | N/A | 29 | 58% |
| Total Gas Expenditures | N/A | N/A | 44 | 88% |
| Total Gas Committed | N/A | N/A | 2 | 4% |
| Administrator Program Cost Breakdown | ||||
| Administration/ Management Costs | 54 | 61% | 30 | 60% |
| Customer Incentive Costs | 56 | 64% | 29 | 58% |
| Education/Marketing/ Outreach Costs | 39 | 44% | 25 | 50% |
| Evaluation Costs | 36 | 41% | 25 | 50% |
| Other Costs[2] | 24 | 27% | 18 | 36% |
| Non-administrator Costs | ||||
| Participant Costs | 26 | 30% | 10 | 20% |
[1] “Committed” spending is program spending associated with measures and projects that are approved, contracted and often implemented during the program year but the actual outlay, e.g., payment of a rebate after installation, occurs after the program year has ended.
[2] Other costs incurred by some program administrator include sales costs, technical assistance and training.
Measure Lifetime Assumptions
As a result of the limited reporting of lifetime savings and program average measure lifetimes by program administrators discussed in Chapter 2, LBNL calculated program average measure lifetime values for each detailed program type and used those values to calculate the program CSE. The electricity and natural gas national program average measure lifetime values used for programs that did not report either lifetime savings or the program specific average measure lifetime are summarized by detailed program type and fuel in Table C-3.
| Sector | Detailed Program Category | Electric Measure Lifetime | Gas Measure Lifetime |
|---|---|---|---|
| C&I | CI: Custom | 17 | 16 |
| C&I | CI: General C&I | 13 | 16 |
| C&I | CI: New Construction | 16 | 19 |
| C&I | CI: Other | 13 | 13 |
| C&I | CI: Prescriptive | 13 | 20 |
| C&I | CI: Self Direct | 13 | NA |
| Commercial | Com/Custom | 13 | 14 |
| Commercial | Com/Custom: Commissioning/Retro-Commissioning | 9 | 12 |
| Commercial | Com/Custom: Sm. Commercial | 12 | 17 |
| Commercial | Com/Pres: Grocery | 14 | 10 |
| Commercial | Com/Pres: HVAC | 13 | 11 |
| Commercial | Com/Pres: IT & Office Equipment | 5 | NA |
| Commercial | Com/Pres: Lighting | 12 | 5 |
| Commercial | Com/Pres: Performance Contract/DSM Bidding | 14 | 20 |
| Commercial | Com/Pres: Sm. Commercial | 10 | 11 |
| Commercial | Com/Prescriptive Other | 12 | 15 |
| Commercial | Com: New Construction | 17 | 15 |
| Commercial | Com: Audit | 9 | 11 |
| Commercial | Com: Financing | NA | NA |
| Commercial | Com: Govt./Nonprofit/MUSH | 12 | 17 |
| Commercial | Com: Other | 15 | NA |
| Commercial | Com: Street Lighting | 11 | NA |
| Cross Sectoral/Other | CS: Codes & Standards | 8 | 6 |
| Cross Sectoral/Other | CS: Market Transformation | 7 | 8 |
| Cross Sectoral/Other | CS: Marketing, Education, Outreach | 1 | 1 |
| Cross Sectoral/Other | CS: Multi-Sector Rebates | 12 | 14 |
| Cross Sectoral/Other | CS: Other | 1 | 1 |
| Cross Sectoral/Other | CS: Planning/Eval/Other Prog Support | NA | NA |
| Cross Sectoral/Other | CS: Research | 18 | 18 |
| Cross Sectoral/Other | CS: Shading/Cool Roofs | 22 | 19 |
| Cross Sectoral/Other | CS: Voltage Reduction/Transformers | 15 | NA |
| Cross Sectoral/Other | CS: Workforce Development | 1 | 1 |
| Industrial/Ag | IA/Custom: Data Centers | 14 | NA |
| Industrial/Ag | IA/Custom: Ind. & Ag. Process | 14 | 14 |
| Industrial/Ag | IA/Custom: Refrigerated Warehouses | 16 | 16 |
| Industrial/Ag | IA/Pres: Agriculture | 11 | 11 |
| Industrial/Ag | IA/Pres: Motors | 17 | NA |
| Industrial/Ag | IA: Financing | NA | NA |
| Industrial/Ag | IA: Self Direct | 13 | NA |
| Industrial/Ag | IA: Audit | 3 | 3 |
| Industrial/Ag | IA: Custom | 13 | 15 |
| Industrial/Ag | IA: New Construction | NA | NA |
| Industrial/Ag | IA: Other | 12 | 11 |
| Industrial/Ag | IA: Prescriptive | 10 | 6 |
| Low Income | Low Income | 12 | 18 |
| Residential | Res: Appliance Recycling | 7 | 5 |
| Residential | Res: Behavioral/Online Audit/Feedback | 1 | 1 |
| Residential | Res: Consumer Product Rebate/Appliances | 11 | 15 |
| Residential | Res: Consumer Product Rebate/Electronics | 7 | NA |
| Residential | Res: Consumer Product Rebate/Lighting | 7 | 10 |
| Residential | Res: Financing | NA | NA |
| Residential | Res: General | 4 | 22 |
| Residential | Res: HVAC | 15 | 16 |
| Residential | Res: Insulation | 22 | 22 |
| Residential | Res: Multi-Family | 12 | 15 |
| Residential | Res: New Construction | 21 | 21 |
| Residential | Res: Other | 14 | 25 |
| Residential | Res: Pool Pump | 10 | NA |
| Residential | Res: Prescriptive | 11 | 17 |
| Residential | Res: Water Heater | 12 | 15 |
| Residential | Res: Whole Home/Audits | 10 | 16 |
| Residential | Res: Whole Home/Direct Install | 11 | 19 |
| Residential | Res: Whole Home/Retrofit | 15 | 21 |
| Residential | Res: Windows | 20 | 20 |
Data Quality Assurance and Quality Control
Our analysis relies on data provided by energy efficiency program administrators to their state regulatory agencies. Thus, ours is a secondary data research project, one that involves the gathering and use of existing data for purposes other than those for which they were originally collected. Often, the program administrator’s primary purpose was to fulfill a state reporting requirement to provide cost and savings data to public utilities commissions and other stakeholders and not necessarily to support multi-state aggregation and comparative analysis.
In order to address potential data quality issues arising from the variation in the content, format and definitions of the reported data from multiple states and administrators, as well as data entry errors, we developed data quality assurance (QA) guidance for the data entry process, and implemented quality control (QC) steps to assure the entered data met the QA plan standards.
Quality Assurance
To inform the development of our QA guidance, we identified four classes of potential errors with respect to the use of the data for this project:
- Potential errors, gaps, inconsistencies or changes in the source data. We found examples of reported data that were incorrectly defined, calculated, reported, or otherwise documented in the source report or updated information became available (e.g., in the form of errata sheets or a revised report from a program administrator);
- Potential errors in manual data input. During our QA/QC process, not surprisingly, we found transcription errors where LBNL staff did not correctly enter data from a source report into the LBNL DSM Program Impacts Database spreadsheet (e.g., erroneously taking from a different line than the desired data or incorrect unit conversions);8
- Questions or potential errors in interpretation of the data. During the QA/QC process, we found examples where LBNL staff that reviewed initial data entry decided that an individual program had not been properly categorized based on the LBNL program typology or that a cost had been misclassified. Classifying programs into detailed program categories or assigning certain highly detailed costs into LBNL-defined cost categories often involved judgment calls and additional research by LBNL staff.
- Potential intermediate calculation errors within the database spreadsheet that may affect data cells, e.g., net-to-gross savings conversions, unit conversions (e.g., mcf to therms) or allocating costs between fuels for combined-fuel program administrators.
The QA guidance included the following key provisions:
- Archive all source reports and document the name, date and original source location of all source reports.
- Use annual energy efficiency reports filed by program administrators as the primary data source. Evaluation reports and portfolio plans were consulted on a very limited basis used to fill in gaps in the program administrator report, e.g., by supplying net-to-gross ratios, budgets or projected savings estimates.
- Collect data from all energy efficiency programs including resource programs and non-resource programs, regardless of whether they report cost and savings data.
- Exclude all renewable energy (including solar hot water), demand response/load management, and combined heat and power programs for this initial report.
- Flag all data that are difficult to interpret appropriately. All data entered must conform to the typology and metrics definitions.
- Document decisions made to resolve interpretation questions (e.g., program categorization or definition of a program’s savings data (e.g., net vs. gross, reported vs. verified).
Quality Control
The QC process attempted to address each of the four identified classes of potential error. It is important to note that we made the general assumption that the primary data was correct and accurate, as we did not have the resources to validate the information reported by program administrators. Moreover, program reports rarely indicated the level of potential error or uncertainty in the reported data, thus we cannot discern how much uncertainty this may have added to our analysis results.
The following QC activities were conducted to address each of the four classes of potential sources of data errors:
- Errors, gaps, inconsistencies or changes in the source data. Reviewing of program data for inconsistencies or unreasonableness. In a few cases we identified errors in the reported data (e.g., incorrect/inconsistent unit listed, or the same data presented in different tables in a single report not matching), and, based on a review of other information in the report, made a determination on the appropriate values to use.
- Identification and exclusion of programs that are not energy efficiency programs (i.e., renewable energy, demand response, combined heat and power).
- Flagging programs that did not report energy savings or program expenditures or either. In many cases these were non-resource program types (e.g., education, research) for which the administrator does not claim savings. These were coded for analysis at the portfolio-level only, and were excluded from the program-level analysis.
- Flagging programs for which the appropriate categorization was not readily apparent. These programs were discussed by the research team and informed the final categorization scheme.
- Following the initial data entry process, a revision process was completed that included a search for errata sheets or revised reports.
- Errors in manual data input. Where feasible, each administrator’s costs and savings data were summed and compared to the reported portfolio-level energy efficiency costs and savings for the applicable categories to create “check sums.”9 For example, the gross savings for all residential programs of one administrator were summed and compared against the total savings reported by that program administrator for their residential portfolio. This was not possible in some cases (e.g., where a program administrator included residential demand response and efficiency programs in their sector totals).
- Following the initial data entry process, a revision process was completed by each LBNL researcher, which included a review of all data entered to check for completeness and errors and check that categorization and cost data matched LBNL definitions. In addition, the analyst indicated the level of confidence that the program was categorized correctly.
- Pivot tables were set up in the database spreadsheet to make preliminary calculations of the CSE which enabled quick identification of data outliers. LBNL researchers then traced these entries back to the source document to determine whether a data entry error was made. We did not eliminate outliers from the database and with the exception of obvious errors in the source data, we assumed that the reported data was correct.
- To further reduce the risk of data entry errors, a subsequent quality control (QC) process was completed in which the research team reviewed each others’ entries, reviewing all of the data and program categorizations for a minimum of two program administrators from two different years, in each of the 31 states. If significant discrepancies were found, the second researcher conferred with the first to see whether there was a rationale for the discrepancy. If no rationale existed for the discrepancy, data was corrected to the satisfaction of the researchers.
- Errors in interpretation of the secondary data. Researchers referred to the LBNL categorization scheme and data metrics definitions to verify interpretation of the data for the initial data entry and two review rounds. The definitions and differences between (a) net and gross savings and (b) verified and claimed savings as reported in data sources were not necessarily consistent among different program administrators. Researchers reviewed any available definitions in the reporting documents to ensure the savings data entered for net/gross and reported/verified matched the LBNL project definitions. Any discrepancies were resolved by discussion amongst the researchers.
- QAQC for potential calculation errors. Potential intermediate calculation errors in the inputted data were reviewed during the QAQC process by a second staff person, and any discrepancies or concerns were resolved and fixed as necessary.
- All formulas used to calculate or report results within the database were reviewed by at least two staff, to verify that the correct data was being referenced and that the formula was correct.
- In some cases, results were verified by recalculating the values.
Updating the Program Typology and Data Metrics
We believe that the program category typology and data definitions will be most useful if they are adopted by program administrators that report the data. We expect that this naming convention and definition consistency can reduce the effort and improve the quality of the efficiency industry’s efforts to compile, analyze and report energy efficiency program information. To this end, we have reviewed these categories and definitions with the CEE, NEEP/REED, and ACEEE staff that are collecting and analyzing data for their own efforts. We also have shared the definitions with EIA for their consideration in future efficiency program inventories they may undertake.
As part of the ongoing LBNL Cost of Saved Energy Project, we intend to continue collecting annual data on programs implemented throughout the United States and to use the program categories and metric definitions for organizing, reporting and analyzing the information. We expect that the program typology and data definitions will not be static. Existing programs will evolve in design or implementation. New program types will emerge. New information and additional data will become available to refine the typology. Therefore, prior to the start of the next data collection cycle, we intend to send out a request for comments to stakeholders and use input from stakeholders to inform revisions to the sector and program typology and definitions. Possible changes include additions or subtractions of categories due to program changes in the market, corrections of errors, and improvements or clarifications in descriptions and definitions. We plan to repeat this input solicitation and update process periodically.
Appendix D. Selection of Discount Rates for Calculating Levelized Costs of Saved Energy
This appendix provides considerations and background information that informed our choice of discount rates to use in calculating the levelized cost of saved energy.
Several sources and analyses were reviewed in order to survey a range of values and rationales for their use, including:
- Energy Information Administration (EIA) documentation for the 2013 Annual Energy Outlook. EIA used a real discount rate of 6.6% for calculating the levelized cost of new generation resources. This value is intended to represent a real, after-tax, weighted-average cost of capital for investors in new generators.10
- White House Office of Management and Budget (OMB) guidance for federal agencies engaging in regulatory analyses. In Circular A-94, OMB advises using real discount rates of 7% and 3%, respectively, as proxies for the costs of capital to the private sector (weighted among all consumers) and the “social rate of time preference” or societal discount rate. According to the circular:
“If we take the rate that the average saver uses to discount future consumption as our measure of the social rate of time preference, then the real rate of return on long-term government debt may provide a fair approximation. Over the last thirty years, this rate has averaged around 3 percent in real terms on a pre-tax basis. For example, the yield on 10-year Treasury notes has averaged 8.1 percent since 1973 while the average annual rate of change in the CPI over this period has been 5.0 percent, implying a real 10-year rate of 3.1 percent.”
- Friedrich, et al. (2009), a survey of program administrator costs of efficiency and therefore one of the most recent analogues for this study, used a real discount rate of 5% for calculating levelized costs. The authors noted:
“…analyses use utility costs in this calculation (i.e., the “Utility Cost test” or “Program Administrators Cost test”) for two primary reasons. First, the Utility Cost test is more comparable to the way utilities assess other supply resources than other tests are. Second, many states do not report customer costs and/or non-energy benefits in their summary reports, thus making it impractical to try to base these calculations on a Total Resource Cost perspective, which includes both customer and utility program costs.”
- The Northeast Energy Efficiency Partnership offers the following in their 2010 Common Statewide Energy Efficiency Reporting Guidelines:11
“There is a range of discount rates that can be used to determine levelized cost of savings, including:
- a utility’s weighted average cost of capital or weighted cost of debt and equity;
- a 12-month rolling average rate on the 10-year T-note;
- an average homeowner’s discount rate; and/or
- some average of all of these.”
- In its own review of DSM portfolio plans, cost-effectiveness reporting and cost-of-capital proceedings, LBNL finds a range of nominal, after-tax WACCs for electric utilities during the time frame for most of the program data concentrated around 7.5%. Correcting for inflation would result in a real utility WACC of about 6%.
We observed that higher costs of capital generally were used when the assumed investor is characterized by multiple economic actors with different rates for equity and debt interest, e.g., the selection of 7% real by OMB to represent the cost of capital for the private sector or 6.6% by EIA to represent the cost of capital for all investors in power plants.
Based on our review, we selected real discount rates of 3% and 6% in calculating levelized costs of saved energy.
Appendix E: Cost of Saved Energy Results for Sectors and Types of Programs
In this appendix, we present the CSE values underlying the figures and charts presented in Chapter 3. The following tables present the national and regional levelized CSE values by sector, simplified program type and detailed program type. Each table includes the savings weighted average CSE, the 1st quartile, the median, and the 3rd quartile levelized CSE values. The number of programs indicates only the programs in the LBNL DSM Impacts Database for which a program specific CSE can be calculated (i.e., that program reports both savings and expenditures). The savings-weighted average CSE may include programs where there are expenditures but little to no savings.
Table E-1 shows the national levelized CSE by sector, calculated using both the 3% and 6% discount rates. Table E-2 shows the regional levelized CSE, calculated using both the 3% and 6% discount rates. The median values for the regions range from $0.016 to $0.041 per kwh using the 3% discount rate.
| Levelized CSE (3% discount) (2012$/kwh) | Savings Weighted Average | 1st Quartile | Median | 3rd Quartile | Number of Programs |
|---|---|---|---|---|---|
| C&I | $0.018 | $0.012 | $0.022 | $0.042 | 986 |
| Cross Sector/Other | $0.014 | $0.011 | $0.024 | $0.070 | 96 |
| Low Income | $0.059 | $0.033 | $0.062 | $0.134 | 200 |
| Residential | $0.016 | $0.015 | $0.032 | $0.074 | 618 |
| Levelized CSE (6% discount) (2012$/kwh) | Savings Weighted Average | 1st Quartile | Median | 3rd Quartile | Number of Programs |
| C&I | $0.021 | $0.014 | $0.027 | $0.049 | 986 |
| Cross Sector/Other | $0.017 | $0.013 | $0.028 | $0.080 | 86 |
| Low Income | $0.070 | $0.040 | $0.073 | $0.159 | 200 |
| Residential | $0.018 | $0.018 | $0.038 | $0.089 | 618 |
Values in this table are based on the 2009-2011 data in the LBNL DSM Program Impacts Database. CSE values are for administrator costs and based on gross savings. Savings are levelized at 6% real discount rate. The savings-weighted average CSE is calculated using all savings and expenditures at the level of analysis. The inter-quartile range and median CSE values are based on calculations for each individual program.
| Levelized CSE (3% discount) (2012$/kwh) | Savings Weighted Average CSE | 1st Quartile | Median | 3rd Quartile | Number of Programs |
|---|---|---|---|---|---|
| Midwest | $0.011 | $0.008 | $0.016 | $0.041 | 399 |
| Northeast | $0.028 | $0.019 | $0.041 | $0.105 | 427 |
| South | $0.022 | $0.013 | $0.029 | $0.092 | 290 |
| West | $0.020 | $0.019 | $0.033 | $0.054 | 792 |
| Levelized CSE (6% discount) (2012$/kwh) | Savings Weighted Average CSE | 1st Quartile | Median | 3rd Quartile | Number of Programs |
| Midwest | $0.014 | $0.009 | $0.018 | $0.047 | 399 |
| Northeast | $0.033 | $0.022 | $0.049 | $0.131 | 427 |
| South | $0.028 | $0.015 | $0.036 | $0.109 | 290 |
| West | $0.023 | $0.023 | $0.040 | $0.063 | 792 |
Values in this table are based on the 2009-2011 data in the LBNL DSM Program Impacts Database. CSE values are for administrator costs and based on gross savings. Savings are levelized at 6% real discount rate. The savings-weighted average CSE is calculated using all savings and expenditures at the level of analysis. The inter-quartile range and median CSE values are based on calculations for each individual program.
Table E-3 shows the residential levelized CSE using a 6% discount rate at both the simplified and detailed program categories. At the detailed program category level, the median values range from $0.009 (Consumer Product Rebate: Lighting) to $0.116 (Whole Home: Retrofit) per kwh.
Table E-4 shows the commercial and industrial levelized CSE using a 6% discount rate at both the simplified and detailed program categories. At the detailed program category level, the median values range from $0.004 (CI: Self Direct) to $0.324 (Industrial/Agriculture: Audit) per kWh.
| Levelized CSE (6% discount) (2012$/kwh) | Savings Weighted Average | 1st Quartile | Median | 3rd Quartile | Number of Programs |
|---|---|---|---|---|---|
| R: All Other Residential | $0.040 | $0.021 | $0.024 | $0.040 | 8 |
| R: Behavior/Education | $0.161 | $0.040 | $0.062 | $0.081 | 23 |
| R: Consumer Product Rebate | $0.009 | $0.010 | $0.019 | $0.035 | 196 |
| R: Multi Family | $0.031 | $0.020 | $0.039 | $0.051 | 36 |
| R: New Construction | $0.021 | $0.029 | $0.058 | $0.112 | 81 |
| R: Prescriptive | $0.016 | $0.024 | $0.055 | $0.112 | 139 |
| R: Whole Home Upgrade (Inc. audits, retrofits, etc.) | $0.051 | $0.034 | $0.089 | $0.212 | 135 |
| Levelized CSE (6% discount) (2012$/kwh) | Savings Weighted Average | 1st Quartile | Median | 3rd Quartile | Number of Programs |
| Res: Consumer Product Rebate/Lighting | $0.007 | $0.007 | $0.009 | $0.014 | 81 |
| Res: Consumer Product Rebate/Appliances | $0.033 | $0.042 | $0.058 | $0.101 | 36 |
| Res: Consumer Product Rebate/Electronics | $0.014 | $0.013 | $0.017 | $0.025 | 6 |
| Res: Behavioral/Online Audit/Feedback | $0.161 | $0.040 | $0.062 | $0.081 | 23 |
| Res: General | $0.040 | $0.024 | $0.025 | $0.026 | 2 |
| Res: HVAC | $0.024 | $0.044 | $0.081 | $0.159 | 85 |
| Res: Insulation | $0.019 | $0.009 | $0.015 | $0.044 | 8 |
| Res: Multi-Family | $0.031 | $0.020 | $0.039 | $0.051 | 36 |
| Res: New Construction | $0.021 | $0.029 | $0.058 | $0.112 | 81 |
| Res: Other | $0.039 | $0.021 | $0.024 | $0.051 | 6 |
| Res: Pool Pump | $0.035 | $0.029 | $0.033 | $0.043 | 4 |
| Res: Prescriptive | $0.011 | $0.011 | $0.018 | $0.025 | 33 |
| Res: Water Heater | $0.065 | $0.013 | $0.034 | $0.060 | 6 |
| Res: Appliance Recycling | $0.019 | $0.017 | $0.022 | $0.030 | 73 |
| Res: Whole Home/Retrofit | $0.053 | $0.039 | $0.116 | $0.271 | 85 |
| Res: Whole Home/Audits | $0.052 | $0.033 | $0.072 | $0.107 | 31 |
| Res: Windows | $0.027 | $0.032 | $0.046 | $0.052 | 3 |
| Res: Whole Home/Direct Install | $0.061 | $0.019 | $0.060 | $0.264 | 19 |
Values in this table are based on the 2009-2011 data in the LBNL DSM Program Impacts Database. CSE values are for administrator costs and based on gross savings. Savings are levelized at 6% real discount rate. The savings-weighted average CSE is calculated using all savings and expenditures at the level of analysis. The inter-quartile range and median CSE values are based on calculations for each individual program.
| Levelized CSE (6% discount) (2012$/kwh) | Savings Weighted Average | 1st Quartile | Median | 3rd Quartile | Number of Programs |
|---|---|---|---|---|---|
| CI: Custom | $0.020 | $0.014 | $0.025 | $0.047 | 287 |
| CI: Prescriptive | $0.015 | $0.011 | $0.023 | $0.042 | 259 |
| CI: Small Commercial | $0.035 | $0.022 | $0.036 | $0.053 | 93 |
| CI: New Construction | $0.026 | $0.015 | $0.027 | $0.036 | 75 |
| CI: MUSH & Govt. | $0.034 | $0.032 | $0.050 | $0.084 | 230 |
| CI: All Other | $0.010 | $0.004 | $0.011 | $0.018 | 42 |
| Levelized CSE (6% discount) (2012$/kwh) | Savings Weighted Average | 1st Quartile | Median | 3rd Quartile | Number of Programs |
| CI: Custom | $0.020 | $0.011 | $0.018 | $0.034 | 65 |
| CI: General C&I | $0.015 | $0.011 | $0.014 | $0.017 | 10 |
| CI: New Construction | $0.026 | $0.021 | $0.029 | $0.036 | 24 |
| CI: Other | $0.015 | $0.012 | $0.023 | $0.024 | 5 |
| CI: Prescriptive | $0.010 | $0.008 | $0.010 | $0.019 | 39 |
| CI: Self Direct | $0.004 | $0.002 | $0.004 | $0.009 | 9 |
| Com/Custom | $0.019 | $0.011 | $0.021 | $0.032 | 66 |
| Com/Custom: Commissioning/Retro-Commissioning | $0.021 | $0.013 | $0.025 | $0.041 | 36 |
| Com/Custom: Sm. Commercial | $0.039 | $0.029 | $0.047 | $0.060 | 31 |
| Com/Pres: Grocery | $0.027 | $0.004 | $0.027 | $0.032 | 9 |
| Com/Pres: HVAC | $0.030 | $0.018 | $0.034 | $0.053 | 44 |
| Com/Pres: IT & Office Equipment | $0.022 | $0.022 | $0.025 | $0.032 | 4 |
| Com/Pres: Lighting | $0.013 | $0.009 | $0.012 | $0.026 | 42 |
| Com/Pres: Performance Contract/DSM Bidding | $0.016 | $0.011 | $0.019 | $0.025 | 12 |
| Com/Pres: Sm. Commercial | $0.038 | $0.021 | $0.035 | $0.052 | 62 |
| Com/Prescriptive Other | $0.023 | $0.018 | $0.027 | $0.052 | 61 |
| Com: New Construction | $0.024 | $0.015 | $0.024 | $0.034 | 51 |
| Com: Audit | $0.035 | $0.025 | $0.108 | $0.227 | 12 |
| Com: Govt./Nonprofit/MUSH | $0.036 | $0.033 | $0.050 | $0.078 | 225 |
| Com: Other | $0.008 | $0.008 | $0.009 | $0.011 | 2 |
| Com: Street Lighting | $0.083 | $0.008 | $0.096 | $0.109 | 5 |
| IA/Custom: Data Centers | $0.038 | $0.048 | $0.053 | $0.059 | 5 |
| IA/Custom: Ind. & Ag. Process | $0.022 | $0.021 | $0.033 | $0.045 | 68 |
| IA/Custom: Refrigerated Warehouses | $0.029 | $0.028 | $0.028 | $0.034 | 3 |
| IA/Pres: Agriculture | $0.024 | $0.022 | $0.027 | $0.037 | 17 |
| IA/Pres: Motors | $0.013 | $0.009 | $0.014 | $0.032 | 25 |
| IA: Self Direct | $0.006 | $0.002 | $0.008 | $0.022 | 16 |
| IA: Audit | $0.330 | $0.317 | $0.324 | $0.354 | 6 |
| IA: Custom | $0.017 | $0.013 | $0.018 | $0.046 | 26 |
| IA: Prescriptive | $0.031 | $0.028 | $0.031 | $0.032 | 6 |
Values in this table are based on the 2009-2011 data in the LBNL DSM Program Impacts Database. CSE values are for administrator costs and based on gross savings. Savings are levelized at 6% real discount rate. The savings-weighted average CSE is calculated using all savings and expenditures at the level of analysis. The inter-quartile range and median CSE values are based on calculations for each individual program.
Appendix F. Regression analysis of potential influences on the cost of saved energy: conceptual framework and data
This appendix discusses our approach used to explore possible relationships between the cost of saved energy (CSE) and various factors that we hypothesized were influences on variability in the CSE (see Chapter 4). The selection of variables as proxies for these theorized influences are described, as well a preliminary statistical analysis of these relationships.
For our dependent variable, we chose the first-year electric CSE, which is simply the program administrator cost ($2012) divided by first-year gross electricity savings (in kilowatt hours. With the cost of saved energy metric selected, we identified and collected independent variables as proxies for the factors identified as potential influences over the cost of saved energy.
Figure F-1 summarizes the process and steps used to conduct this initial exploratory analysis. Topics discussed in this appendix are highlighted in a darker shade.
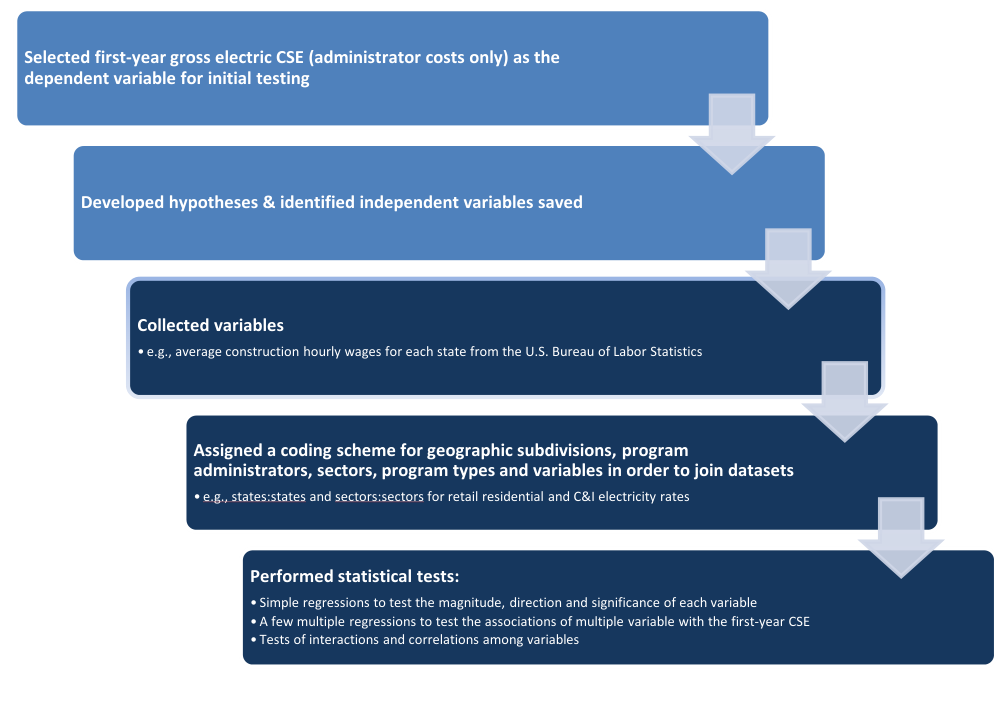
We developed data for the proxy variables from a number of sources, which are shown in the last column of Table F-1. Additional independent variables, drawn from these and other sources, are expected to be analyzed in more depth in subsequent reports of the LBNL CSE Project.
| Theorized Influences over the Cost of Saved Energy | Hypothesis | Proxy Variable12 | Level at Which Variable Was Tested | Source for Proxy Variable Data |
|---|---|---|---|---|
| Program Administrator Experience | Program administrators with more experience learn to deliver programs more effectively and efficiently, with resulting cost reductions. | Years of energy efficiency program spending from 1999-2012 above a de minimums threshold | Portfolio and sector levels | U.S. Energy Information Administration Form 861 survey13 data, 1999-2012 |
| Scale of Program | Larger programs reap economies of scale and thus have lower relative costs. | Number of participants | Program level | LBNL CSE database |
| Labor Costs | Acquiring energy savings in areas with higher labor costs tend to be more costly because labor is a significant component of both administrative and (indirectly) incentive costs. | State average wages for the construction industry | Portfolio, sector, and program levels | U.S. Bureau of Labor Statistics |
| State Policy Environment | Strong efficiency policies can both raise the baseline for energy savings potential and drive program administrators to reach deeper into the economy for savings, both factors that over time are likely to result in costlier savings. | Estimated statewide savings targets, as a percent of retail sales | Program administrator (portfolio), sector, and program levels | Reports by LBNL, the Regulatory Assistance Project (RAP) and ACEEE |
| Retail Rate Environment | Higher retail energy costs encourage more customers to invest in energy savings, thus lowering the administrators’ costs of securing participation and savings. | Residential, commercial and industrial retail rates | Commercial and Industrial (C&I) and residential sectors | U.S. EIA 826, 861 reports (Monthly Electric Sales and Revenue Report with State Distributions and the Annual Electric Power Industry Report) |
These data were coded by geography or program administrator in order to be merged with program data from the LBNL cost of saved energy database.14 For example, each state was identified by the two-digit code developed by the American National Standards Institute (ANSI), which is commonly used by the Census Bureau and several other federal agencies and which closely mirrors the former Federal Information Processing Standards (FIPS) codes that other federal agencies retain in legacy databases. We combined these ANSI codes with codes that the U.S. Department of Energy’s Energy Information Administration has assigned to utilities and DSM program administrators in order to generate a unique identifier for each program administrator. These codes supplied common identifiers for joining datasets on years of program spending, retail rates, and state average hourly wages for the construction industry.
Using a widely available software package designed for statistical analysis,15 we performed simple ordinary least squares (OLS) regressions and a limited number of multivariate regressions. OLS quantifies the degree to which the dependent variable (e.g., the first-year gross electric CSE) varies in response to changes in the independent variable, holding constant all other included independent variables.16
The following regression specification was used:
CSEi = α + β1x1 + etc. + εi
Where:
- CSEi is the dependent variable for each program (the first-year gross electric cost of saved energy);
- x1, x2, etc., are independent variables, estimators or regressors, which are the factors posited to be associated with changes in the dependent variable;
- β1, β2, etc., are the coefficients that estimate the relationship of the independent variables with the dependent variable;
- εi is an error term that captures the variability of the dependent variable that is unexplained by the linear prediction based upon the regressors.
The magnitude and sign of the coefficient on each independent variable x indicate the estimated size and direction (reduction or increase) in y, all other things being equal. A t-test and the associated P-value indicates the statistical significance of an independent variable. When P < 0.05, the tested relationship is said to be statistically significant at the 5 percent level, which means that there is only a 5 percent chance that we would see our estimate if there were truly no relationship between the dependent and independent variable.
We performed linear-linear regressions (e.g., a one unit change in xi would be associated with a βi unit change in y); log-linear regressions (a one unit change in xi would be associated with a 100 * βi percent change in y); and log-log regressions (a one percent change in xi would be associated with a βi percent change in y).
We conducted regression analyses at three levels: the level of program administrators’ portfolios or full suite of programs, at the level of targeted sector (e.g., commercial or residential), and at the level of individual program types and programs. Where possible, we took advantage of the large sample sizes afforded by certain, highly common program types. In some cases, however, we aggregated and analyzed data at the portfolio and sector level in order to examine larger scale influences and to moderate the influence of portfolios with many programs in a sector (e.g., California supplied more than 1,000 program years of data and so account for more than 25 percent of our dataset, compared to tens of program years of data from smaller states). By aggregating program data up to the sector or portfolio level, for example, CSE data from California has equal weight with data from Vermont, such that cost variability for a given sector is not skewed by the predominance of data from larger states in the sample.
Table F-2 summarizes the regression results described in the main body of the report for this preliminary analysis.
| Theorized Influence over the Cost of Saved Energy | Proxy Variable | Correlation Coefficient | P-value | Level of Statistical Significance |
|---|---|---|---|---|
| Program Administrator Experience | Years of program administrator spending above a de minimis threshold | -0.0211731 | 0.196 | 20% |
| Years of program administrator spending ^2 | 0.0016974 | 0.147 | 15% | |
| Scale of Program | Number of participants in refrigerator recycling programs | -9.41E-06 | 0.035 | 5% |
| Labor Costs | State average construction hourly wages | 0.01468 | 0.001 | 1% |
Footnotes
- The levelized cost of conservation has since been applied to a number of resources, such as water.
- See http://www.cee1.org/annual-industry-reports.
- See http://neep.org/emv-forum/about-the-emv-forum/index.
- See http://www.eia.gov/efficiency/programs/inventory/
- The rationale and process for developing the program typology and data glossary are described in Chapter 2, but more detail is provided in an August 2013 policy brief that is devoted to the subject. The brief, titled “Energy Efficiency Program Typology and Data Metrics: Enabling Multi-State Analyses Through the use of Common Terminology,” may be accessed at http://emp.lbl.gov/sites/all/files/lbnl-6370e.pdf.
- The detailed program categories could be organized in other ways, such as by technology.
- Program data were provided in a variety of formats: PDF, MS Word and MS Excel files.
- For example, some programs report lifetime electric savings in MWH, some in GWH and some in kWh, so the researcher transferring data from primary source into the database must make the correct unit conversion.
- Not all program administrators report energy efficiency program only totals; some include expenditures and/or savings from non-efficiency programs (i.e. renewable energy, demand response, or combined heat and power). Where this is the case, expenditures and savings totals may not add up to reported expenditures and savings. Additionally, in some cases, there may be programs that were categorized according to the LBNL program typology that differ from the way a program administrator categorized the program (i.e. a low income may have been included in the program administrators residential sector summary. However, LBNL analysts will have identified that as a low income program and it is reported in a separate sector summary. Under these circumstances, the project manager examined each non-standard case and verified that the cost or savings totals were accurate and made sense.
- EIA Levelized Cost of New Generation Resources in the Annual Energy Outlook 2013, January, 2013 http://www.eia.gov/forecasts/aeo/electricity_generation.cfm
- http://neep.org/Assets/uploads/files/emv/emv-products/EMV%20Forum_Statewide_EE_Reporting_Guidelines_12-30-10.pdf NEEP chose to use 2.46% real as its discount rate.
- The listed variables are not exclusive but provided for illustrative purposes. Additional variables were tested for some hypotheses.
- We measured experience as the number of years that each administrator has funded program portfolios at 0.1 percent of retail revenues for that administrator or for utilities in that administrator’s territory. Where a time series of program funding could not be obtained (e.g., through gaps in reporting or a belatedly recognized program administrator), we used the launch date for a multi-sector portfolio by that administrator or, in a few cases, relied upon in-house knowledge of the level of energy-efficiency activity by that administrator.
- Not all data for independent variables are listed here. Participation data already was associated with programs for which those numbers were reported and so did not require additional coding.
- STATA version 12.1, developed by StataCorp LP, 4905 Lakeway Drive, College Station, Texas.
- OLS accomplishes this by minimizing the sum of the squares of the distances between actual and predicted linear values for the dependent variable.
This document is a work of the U.S. government or a government-funded laboratory and is reproduced in full for research and educational purposes. Logistics Lighting has re-formatted it for readability; the wording is the original author's. Report an error at info@logisticslighting.com.
← Back to the Daylighting Library