
LBNL-4585E paper explaining why the daylight factor fails as a daylighting metric, introducing climate-based daylight modeling and useful daylight illuminance, with New York Times and VELUX case studies and a discussion of realized energy savings.
Work funded by the U.S. Department of Energy and produced by Lawrence Berkeley National Laboratory, reproduced in full with attribution. Original report: Daylight metrics and energy savings (LBNL-4585E, 2009).
Daylight metrics and energy savings
LBNL-4585E
Authors: J. Mardaljevic, Institute of Energy and Sustainable Development, De Montfort University; L. Heschong, Heschong Mahone Group, Inc.; E.S. Lee, Lawrence Berkeley National Laboratory
Environmental Energy Technologies Division
2009
Published in Lighting Research + Technology 2009; 0: 1-23
Disclaimer
This document was prepared as an account of work sponsored by the United States Government. While this document is believed to contain correct information, neither the United States Government nor any agency thereof, nor The Regents of the University of California, nor any of their employees, makes any warranty, express or implied, or assumes any legal responsibility for the accuracy, completeness, or usefulness of any information, apparatus, product, or process disclosed, or represents that its use would not infringe privately owned rights. Reference herein to any specific commercial product, process, or service by its trade name, trademark, manufacturer, or otherwise, does not necessarily constitute or imply its endorsement, recommendation, or favoring by the United States Government or any agency thereof, or The Regents of the University of California. The views and opinions of authors expressed herein do not necessarily state or reflect those of the United States Government or any agency thereof or The Regents of the University of California.
J. Mardaljevica, L. Heschongb, E.S. Leec
aInstitute of Energy and Sustainable Development, De Montfort University, The Gateway, Leicester, LE1 9BH, UK
bHeschong Mahone Group, Inc., 11626 Fair Oaks Blvd, #302, Fair Oaks, CA 95628, USA
cBuilding Technologies Program, Environmental Energy Technologies Division, Lawrence Berkeley National Laboratory, Mailstop 90-3111, 1 Cyclotron Road, Berkeley, CA 94720, USA
Abstract
The drive towards sustainable, low-energy buildings has increased the need for simple, yet accurate methods to evaluate whether a “daylit” building meets minimum standards for energy and human comfort performance. Current metrics do not account for the temporal and spatial aspects of daylight, nor of occupants comfort or interventions. This paper reviews the historical basis of current compliance methods for achieving daylit buildings, proposes a technical basis for development of better metrics, and provides two case study examples to stimulate dialogue on how metrics can be applied in a practical, real-world context.
1 Introduction
While there is a great deal of attention paid to the goal of providing well-daylit spaces in our buildings, our ability to describe the parameters of “a well-daylit space” have not progressed in the past few decades. Daylight illumination levels in a space are dynamic, constantly changing both in intensity and spatial distribution pattern as the two variable sources of daylight - the sun and the sky - interact with the geometry and physical properties of the space, the exterior context, and interior conditions.
Most current evaluations of daylight performance however are made using greatly simplified “snap-shot” or single-point-in-time methods that do not account for all the influences on daylight illumination levels nor the variation over time. Indeed, the most common method, the “Daylight Factor”, does not even include the contribution from sunlight, only skylight, and even then under the simplified assumptions of the International Commission on Illumination (CIE) standard overcast sky distribution. Alternatively, many practitioners try to understand the pattern of sunlight in a space via study of the sun-path diagram, or a dynamic solar shading analysis, but without analysis of resulting illumination levels or the contribution of light from the sky or reflected light from the sun.
While both of these methods provide the experienced designer with some insight into how daylight will be distributed in the space, both provide only a partial understanding. Using these methods, the designer must integrate this information with internalised experience about local weather variation patterns, reflectance of materials, etc., in order to infer the resulting visual qualities of the space. While many experienced designers have indeed achieved an intuitive synthesis of this information, that knowledge is not easily transferred to new locations, evaluated, or communicated to others before a building is constructed. The designers knowledge can only be acquired through on-the-job apprenticeship; it does not lend itself to wide dissemination through classroom teaching, nor can it be codified in standards.
In the last decade, the role that daylight evaluation plays in the design process has acquired a new impetus as the need to demonstrate compliance with various ‘performance indicators’ becomes ever more pressing. Two of the most used rating systems are BREEAM (The BRE Environmental Assessment Method) and LEED (Leadership in Energy and Environmental Design) which originated in the UK and US respectively, though they are both used world-wide [1][2]. Note that, in an effort to harmonise the various rating systems, a Memorandum of Understanding between BREEAM, LEED, the UK Green Building Council and Green Star (Australia) was signed on March 3rd 2009. Both the LEED and the BREEAM websites chart the growth in the building projects that have been certified using the respective schemes. These and similar rating systems are actively promoted by government departments and lobby groups.
As a consequence, building designers are resorting more and more to simulation as a means of demonstrating compliance with the various schemes. This, one might reasonably hope, would lead to noticeable improvements in the practice of design evaluation, which in turn should improve the likelihood of realizing a well-daylit building. However, to the extent that such performance indicators are crude, or the tools used to generate them are unable to differentiate between products or design strategies that result in better or worse performance, then the market is not guided by useful information. Indeed, perverse consequences can result from metrics that cannot distinguish between key inputs or outputs. This paper presents a critique of the current basis for guidelines, and describes new approaches to formulating metrics that should provide a sounder foundation for the evaluation of building performance at the design stage.
2 Daylight: metrics and criteria
The terms daylight and skylight are often used interchangeably, which can lead to confusion where precise definitions are required. Some of this muddle has resulted from the conflation of ‘daylight’ per se with what is predicted by the daylight factor. For example, expressions such as: “the daylight factor was used to evaluate daylight levels”, are common in both research and practice literature. The daylight factor (defined below) is a measure of relative illumination within a space compared to that of a standardised overcast sky condition. It is therefore a crude proxy for actual daylight illumination. Thus what the daylight factor communicates is very different from a prediction of the actual illumination levels that result from the full range of naturally occurring sun and sky conditions.
The term ‘daylight’ in this paper is used to refer to the totality of illumination provided by the sun and the sky. The above-made distinction between ‘direct light’ (i.e that received directly from the sun) and ‘diffuse light’ (i.e. all skylight and diffuse-reflected sunlight) will also be employed. The term ‘daylight factor’ will be used only to indicate that quantity following its strict definition - see Appendix 1.
A metric is some mathematical combination of (potentially disparate) measurements and/or dimensions and/or conditions represented on a continuous scale. A metric may not be directly measurable in the field. A criteria is a demarcation on that metric scale that determines if something passes or qualifies, e.g. three-quarters of the workspace area achieves a 2% daylight factor. The purpose of a metric is to combine various factors that will successfully predict better or worse performance outcomes, and so inform decision making. Performance may be described by more than one metric, i.e. it is not necessary to combine all significant factors into one metric. The most useful metrics have an intuitive meaning for their users and can also be directly measured for validation. This implies a preference for simplicity so they can be intuitively understood, and a direct tie to measurable outcomes. When metrics are sufficiently refined and understood and their predictive capabilities validated, then performance criteria can be set for various guidelines and recommendations.
2.1 The Daylight Factor
Design guidelines worldwide currently recommend daylight provision in terms of the long-established daylight factor (DF). First proposed in the UK in the early 1900s and formalized into building standards over fifty years ago, the daylight factor is simply the ratio of internal illuminance to unobstructed horizontal illuminance under standard CIE overcast sky conditions [3]. It is usually expressed as a percentage, so there is no consideration of absolute illumination values. The luminance of the CIE standard overcast sky is rotationally symmetrical about the vertical axis, i.e. about the zenith. And, of course, there is no sun. Thus for a given building design, the predicted DF is insensitive to either the building orientation (due to the symmetry of the sky) or the intended locale (since it is simply a ratio). In other words, the predicted DF value would be the same if the building had North-facing glazing in Stornoway or South-facing glazing in Brighton. The same would be true if the locations were Seattle and Miami - or indeed for any city in any country. Because the sun is not considered, any design strategies dependant on solar angle, solar intensity, or redirection of sunlight have no influence on the DF.
Actual daylight illumination conditions deviate markedly from the overcast sky paradigm. This is so even for Northern Europe where there is a commonly held belief that skies are ‘mostly’ overcast and so use of the daylight factor as a basis for evaluation is justified. A paper by Littlefair in 1998 gives annual cumulative internal illuminance measurements for a point in similar rooms with North and South facing glazing [4]. The rooms were un-shaded and un-occupied. An illuminance of 200 lux was achieved for approximately 58% and 68% of the year for the North and South facing spaces respectively. However, an illuminance of 400 lux was achieved for only 12% of the year for the North facing space with more than four times that occurrence (51%) for the South facing space. Of course, for sunnier climates the effect of orientation on daylight illumination will be greater still.
Practitioners encounter guidelines and recommendations for target daylight factors values that they know are likely to result in over-glazed buildings with excessive solar gain and/or heat loss. The Heschong Mahone Group did an analysis of six monitored building spaces in California that were reasonably well daylit and saving substantial energy via daylighting controls [5]. However, none of these spaces came close to achieving the then current LEED criteria of “an average of 2% Daylight Factor” throughout the space” [2]. In an attempt to re-design the spaces to meet this criteria, it was found that even with high transmission glass, the window area would need to have been increased by more than the building envelope could accommodate, nor could the spaces have passed energy code performance requirements. Thus daylighting guidelines founded on daylight factors are often in conflict with design criteria for other parameters, e.g. conduction losses or solar gain. This is hardly surprising given the orientation-insenstive and climate-insensitive nature of the daylight factor. Successful daylighting design achieves an optimum balance between daylight provision and daylight control. This elusive optimum will depend on the design of the building, its aspect, the surrounding context and, of course, the prevailing climate. In other words, it will be highly specific to each building and difficult to prescribe in terms of rule-of-thumb design principles. Failure to achieve this optimum balance can result in increased energy use for either lighting or cooling, and sometimes both.
Daylighting of buildings however must also be judged in terms of providing a healthy and pleasant environment for the occupants. The remainder of this section discusses how sustainability and energy-use concerns interact with occupants’ needs and desires to create a raft of stakeholder issues, all of which depend to a greater or lesser degree on the daylighting of buildings - and that these can only be adequately addressed at the design stage by new daylight modelling techniques.
2.2 Sustainability and compliance
The drive towards sustainable, low-energy buildings places increasing emphasis on the need for detailed daylight performance evaluation. This need ranges from useful guidance at the early design stage, to code compliance based on construction documents, to post-occupancy verification. The daylighting performance of a space, and its component parts, are potentially of concern to many stakeholders throughout the life of the building. Stakeholders include those in the following categories:
- Building occupants who prefer or tolerate daylight levels within certain ranges, even if the values at the lower end may be insufficient to act as the sole source of task illumination.
- Those who pay the salaries of the building occupants may wish for a ‘pleasant’ daylit environment as a demonstration of concern for the occupants’ well being, or because of the perceived benefits in productivity and perhaps even staff retention [6][7].
- Those who bear the running cost of the building may wish to maximise daylight exploitation to reduce electric lighting and space conditioning costs. Government and regulatory bodies may wish to encourage the same to reduce energy use or carbon emissions. Utilities may wish to curtail peak electricity demand to defer the need for more power generation capacity [8].
- Those who bear the capital cost of the building will need to be assured that any claimed ‘daylight benefits’ (e.g. quality of environment, amenity value, or reduced operating costs) can be demonstrated at the design stage. Particularly if these daylight benefits incur additional costs at the design and/or construction stage.
- Designers and manufacturers of materials, devices or systems where the provision or control of daylight is a key feature of the product or technology. Examples include: glazing in general, skylights, light-pipes, light re-direction materials (e.g. Serraglaze), light modulating materials (e.g. electrochromic glazing), blinds, shading devices, etc.
- Architectural team who, in their drive to design better solutions, will compare and improve their designs based on performance data.
The list is not complete. For example, some health professionals believe that daily exposure to high levels of daylight illuminance may have significant, long-term health benefits, and that this should be a design consideration [9]. Nor are the categories exclusive - several might apply to an owner-occupier who commissions the design and construction of a building.
Each one of these purposes and associated stakeholders has slightly different needs in terms of the level of detail, precision and format of input and output that would constitute a useful daylight metric. Ideally, the same metrics, or inputs to a metric, could be employed throughout all these phases. Ideally, a metric could be both predicted via simulation and also determined from measurements in the field so that predictions could be verified. As noted, the current bases for guidelines and recommendations are not sufficient to adequately address stakeholder concerns. The following section describes a relatively new daylight modelling approach that has the potential to more fully address the various stakeholder requirements.
2.3 Climate-based daylight modelling
Climate-based daylight modelling is the prediction of various radiant or luminous quantities (e.g. irradiance, illuminance, radiance and luminance) using sun and sky conditions that are derived from standardised annual meteorological datasets. Climate-based modelling delivers predictions of absolute quantities (e.g. illuminance) that are dependent both on the locale (i.e. geographically-specific climate data is used) and the fenestration orientation (i.e. accounting for solar position and non-uniform sky conditions), in addition to the space’s geometry and material properties (see Appendix 1). The operation of the space can also be modeled to varying degrees of precision depending on the type of device (e.g. luminaire, venetian blinds, etc.) and its assumed control strategy (e.g. automatic, by occupant, or some combination). The computational overhead and complexities introduced when attempting to model the operation of the space are discussed later.
The term climate-based daylight modelling does not yet have a formally accepted definition - it was first coined by Mardaljevic in the title of a paper given at the 2006 CIBSE National Conference [10]. However it is generally taken to mean any evaluation that is founded on the totality (i.e. sun and sky components) of time-series daylight data appropriate to the locale over the course of a year. In practice, this means sun and sky parameters found in, or derived from, the standard meteorological data files which contain 8,760 hourly values for a full year. Given the self-evident nature of the seasonal pattern in sunlight availability, a function of both the sun position and the seasonal patterns of cloudiness, an evaluation period of twelve months is needed to capture all of the naturally occurring variation in conditions that is represented in the climate dataset. It is also possible to use real-time monitored weather for a given time period, if calibration to actual monitored conditions within a space is desired. Standardised climate datasets are derived from the prevailing conditions measured at the site over a period of years, and they are structured to represent both the averages and the range in variation that typically occurs. Standard climate data for a large number of locales across the world are freely available for download from several websites. One of the most comprehensive repositories is that compiled for use with the EnergyPlus thermal simulation program [11]. This contains freely-available climate data for over 1200 locations world-wide.
There are a number of possible ways to use climate-based daylight modelling [12][13][14][15][16]. The two principal analysis methods are cumulative and time-series. A cumulative analysis is the prediction of some aggregate measure of daylight (e.g. total annual illuminance) founded on the cumulative luminance (or radiance) effect of (hourly) sky and the sun conditions derived from the climate dataset. It is usually determined over a period of a full year, or on a seasonal or monthly basis, i.e. predicting a cumulative measure for each season or month in turn. Evaluating cumulative measures for periods shorter than one month is not recommended since the output will tend to be more revealing of the unique pattern in the climate dataset than of “typical” conditions for that period. The cumulative method can be used for predicting the micro-climate and solar access in urban environments, the long-term exposure of art works to daylight, and quick assessments of seasonal daylight availability and/or solar shading at the early design stage. Time-series analysis involves predicting instantaneous measures (e.g. illuminance) based on each of the hourly (or sub-hourly) values in the annual climate dataset. These predictions are used to evaluate, for example, the overall daylighting potential of the building, the occurrence of excessive illuminances or luminances, as inputs to behavioural models for light switching and/or blinds usage, and the potential of daylight responsive lighting controls to reduce building energy usage. Thus a daylight performance metric would need to be based on a time-series of instantaneously occurring daylight illuminances since these cannot be reliably inferred from cumulative values. As noted, evaluations should span an entire year. There is some debate as to whether the daily time period of analysis should be all daylit hours, which vary in length with the seasons, a standardized “working day” of 8, 10 or 12 hours, or the actual occupancy pattern of the space. Different purposes are likely to favour different daily analysis periods.
There are some long-standing daylight prediction methods that make use of climate data to estimate either instantaneous or cumulative illuminance. For example, the thermal simulation program DOE-2 has featured a daylight prediction module for over twenty years [17]. These methods however do not explicitly simulate the transport of light in a space and instead employ various crude approximations. Furthermore, they are generally limited to very simple building geometry with basic material properties [18]. In contrast, climate-based daylight modelling refers to techniques that use lighting simulation proper. Additionally, there should be few significant limitations on either the complexity of the building geometry or the properties of the reflecting and transparent materials used since high levels of realism are necessary to adequately simulate the daylit luminous environment for the majority of real building designs.
3 Daylight metrics
3.1 Can daylighting be adequately described by a single daylight metric?
The question posed by the title of this section cannot be answered definitively since “daylighting” is not a well defined property. Notions as to what constitutes “adequate” in this regard are similarly vague also. Although an ill-defined term, there is probably general acceptance that a space with good daylighting is one that minimises visual discomfort and provides high levels of visual quality under solely or predominantly daylight conditions frequently throughout the year. Thus “good daylighting” is some aggregate measure over the year of the degree and frequency of occurrence of instantaneous conditions that are deemed to offer good visual comfort and quality. Eventually, many inputs may be combined into one composite performance metric. In the meantime, studying separate dimensions of the daylit environment independently is likely to be more informative.
The following luminous quantities are, to a greater or lesser degree, identified as factors related to visual comfort and quality, and which can be predicted in a lighting simulation. A number of them are currently under study by the authors and their project teams [16][19][20].
Illuminance on the horizontal plane
The lighting levels required to carry out visual tasks are typically expressed as illuminance on the horizontal plane at desk height. A value of 300-500 lux is commonly recommended for detailed office and clerical work, and many artificial lighting systems are designed to deliver this level of illumination. Whilst it is generally agreed that the visual quality of a space cannot be fully described in terms of horizontal illuminance, this is the most commonly used metric for evaluating the adequacy of illumination levels in a space. In addition to illuminance sufficiency for visual tasks, other concerns for sufficient circadian stimulus levels, or excessive daylight levels leading to glare conditions or overheating, can also be assessed or inferred.
Specifying a grid of points in the horizontal plane where illuminances are to be determined is a relatively straightforward task. The plane(s) of calculation points can be a continuous grid, certain points or zones of interest, or specific task areas.
Field of view luminance
Luminance maps of the visual field can be simulated and, in principle, potential glare sources identified using various glare prediction methods. This technique has been used in the analysis of critical design challenges, such as air traffic control tower design. Simulations can also be compared to high-dynamic range photographs of real spaces. There are however a number of issues relating to the both to the production and interpretation of the data. The computational and data-processing demands are high because of the sheer volume of image data that is generated, e.g. thousands of simulated images for each evaluation point in the space. For each point a view direction needs to be established. And there is the possibility of multiple view directions since small changes in view direction can result in fields of view having very different luminance patterns.
A number of potentially significant glare effects are difficult if not impossible to model with any reliability. For example, glare resulting from specular reflections off a nearby building is a fairly common occurrence. The perceived pattern of luminance resulting from reflection is strongly dependant on the precise geometrical relation between the sun, the viewer, and, say, the reflecting glazing. Any deviation of the reflecting glass from true planar will result in a complex, essentially unpredictable pattern of reflection because, over the distances between buildings, the spread of the reflected rays is amplified. Likewise, reflected glare problems created by snow, water or wet surfaces are highly variable throughout the year. Thus, detailed modelling of these phenomena are impracticable for an instantaneous condition let alone for an annual time-series.
The prediction of high luminances in the field of view due to visible sky on an annual basis is more straightforward [19][21]. There are a number of theoretical glare formulations any of which could be used to analyse the output from a lighting simulation. However, in a recent review paper, the chairperson of CIE Technical Committee ‘Discomfort Glare from Daylight in Buildings’, concluded that the “available assessment and prediction methods are of limited practical use in daylit situations” [22]. More dependable glare models are needed before it is possible to formulate reliable visual quality criteria based on the experienced (or simulated) field of view.
Eye-level grid
Calculations carried out at eye-level across a grid could be used to reveal characteristics of the simulated visual environment that cannot be directly inferred from predictions of the horizontal workplane illuminance. These simulations would be significantly less demanding computationally than predictions for the field of view since the view dependancy of the output is greatly reduced, i.e. point values rather than images. For example, the Daylight Metrics Project in the United States has defined “skyview” as the percent of the skydome directly visible through clear glazing from each eye-level point in the space [20]. This grid is also being used to determine the occurrence of direct sun at eye-level as one indicator of the annual probability for glare problems and to predict when occupants are likely to lower blinds to block the sun.
Ceiling-level grid
Illuminance sensor grids at the ceiling level provide interesting opportunities for analysis. The ceiling plane is often the most continuous surface in a space, without the shadowing common at task level due to furniture and partitions. Thus, ceiling illumination may be useful for understanding distribution patterns and uniformity of daylight illuminance in a space. It is also possible, that as one of the most visible surfaces in a space, it may help predict occupants’ judgment of the overall ‘brightness’ of the space. These hypotheses are under examination by the Daylight Metrics Project [20].
Photosensor response
Sensor points can also be used model the response of a photocell sensor which provides the control for a daylight responsive lighting circuit. This serves as a basis to predict the annual lighting energy demand. The sensor may need to be modelled as a shielded illuminance meter since these are often used to limit the acceptance angle of the sensor, i.e. so that it records mainly the light reflected from the desk by excluding the direct view of other surfaces. In practice, the sensor grid would need to be aligned with the workplane areas. The upper surface of the desks etc. would need to be accurately modelled in the simulation since the illuminance sensed at the ceiling will be very sensitive to the reflective properties of all the surfaces at workplane height. Other sensor placements and orientations are possible and there is no consensus yet on the most effective way to achieve photosensor control of daylight responsive electric lighting. The Sensor Placement and Orientation Tool (known as SPOT) was developed by Rogers to help designers understand these variables in order to optimize photosensor location and type [16].
This list is not exhaustive, however it does cover the principal ways in which simulation is currently being considered to evaluate visual comfort and quality, and also a basis for determining electric lighting usage. Some of the more straightforward metrics based on horizontal illuminance (e.g. useful daylight illuminance and daylight autonomy) can be predicted by tools such as DAYSIM. To predict the full gamut of possible metrics however requires specialised (i.e. ‘user-unfriendly’) research tools.
3.2 Modelling dynamic systems: Accounting for occupant behaviour
Not yet mentioned is the issue of moveable shading devices or variable transmission windows, e.g. electrochromic glazing. Any change in either the building configuration or the transmissive properties of the glazing could significantly add to the complexity of simulating the daylight properties of the building. At present, the most efficient way to model time-series illuminance with, say, Radiance is to employ the daylight coefficient method [23]. In this, the computationally demanding part of the simulation is run as a pre-process using a discretised sky, i.e. one that is broken up into “patches’. Thereafter, the internal daylight illuminance for arbitrary sky and sun configurations (e.g. founded on climate data) can be quickly derived from the pre-computed daylight coefficient values [24]. Each unique building configuration will require a unique set of daylight coefficients. Any change in configuration that is continuously variable (e.g. the degree to which blinds are lowered and/or tilted) may need to be modelled as a limited set of discrete (i.e. step) changes. Each of the discrete building configurations will require a unique set of daylight coefficients - each one adding to the computational overhead of the time-consuming daylight coefficient pre-process. The requirement for some or most of these additional complexities may be eliminated if the effect of the blinds can be approximated as a modulation of the light levels predicted without blinds [25]. The success or otherwise of such approximations will depend entirely on the specifics of the building configuration, in particular the shading devices.
As is evident from the above, accounting for changes in the building configuration can add significantly to the complexity of preparing for and carrying out the simulation. This is a necessary computational overhead however if moveable shading and blinds systems are to be accurately modelled. The control of the shading and blinds systems can be purely automatic (e.g. daylight responsive), purely manual (i.e. occupant controlled) or some mixture of the two. Any attempt to model occupant control of shading devices (and also light switching) adds uncertainty to the output and further complexity to the simulation.. There exists a small body of literature on the way building occupants respond to absolute levels and changes in daylight by operating shading and lighting controls [26][27][28]. The models derived from these studies however all contain a significant probabilistic component since occupant response cannot be anticipated using purely deterministic algorithms [29][30]. Thus a daylight evaluation which includes models for occupant behaviour can therefore produce a range of predicted outputs, ideally encompassing the bounds of likely outcomes. From this range, some judgement would need to be made regarding a probable outcome, or useful best case or worst case assumption, if a single ‘answer’ is needed. Alternatively, larger population studies might be able to establish an acceptable probability function that blinds will be activated at any given time, by orientation, or space type, etc.
It is conceivable that a dynamic, fully-automatic shading system such as electrochromic glazing or automated blinds could be reliably modeled in a purely deterministic fashion, i.e. without the confounding effects of uncertain occupant response to changing conditions [25]. The validity of such an exercise would depend on the assumption that, in the finished building, the occupants do not interfere with or sabotage the control system [31].
3.3 Occupant behaviour and daylight metrics
An evaluation without occupants discloses what may be termed the intrinsic or asset daylighting performance of the building. Uncertainties in behavioural models notwithstanding, a prediction of performance for the occupied building is likely to be closer to that of the actual building when it is in normal use. In an evaluation however, cutting straight to the prediction for the occupied building may result in the designer missing out on opportunities to improve the intrinsic daylighting potential of the building since this might be masked by uncertainties present in the probabilistic models of occupant behaviour. The uncertainties in occupant behaviour are significant for individual side-lit office spaces, they can become overwhelming however for larger spaces with multiple occupants and/or multiple fenestration orientations, where the permutations for shade deployment - and consequent impact on daylight provision - become enormous. It is suggested therefore that a design evaluation should always begin with the intrinsic daylighting performance of the space, and only then should the simulations be repeated with behavioural models added. Evaluations to comply with codes or standards are likely to require that default assumptions be employed to model blinds operation, electric lighting system operation, or other dynamic elements, in order to create a “level playing field” for comparison of designs.
Regardless of building design, the majority of spaces in a building will require use of a shading device at some time or other to control the ingress of daylight, i.e. direct sun and/or high levels of diffuse light. The frequency of deployment of shading devices will depend in large part on how well the basic architectural form of the building serves to temper the luminous environment of the internal spaces. The degree to which this can be achieved will be determined by the massing properties of the building and its context, along with the placement of fenestration and exterior shading devices.
In the short term, evaluation of spaces that are not so dependant on blinds or other dynamic devices for solar control, will be more straightforward, and may lead to early understanding of the value of various metrics. Ultimately, the complexities of a dynamic occupant response to dynamic daylighting conditions should be within the capabilities of climate-based daylight simulation tools, and would best be supported by more definitive predictions of those responses.
3.4 Modelling complex fenestration systems
Complex fenestration systems (CFSs) such as prismatic glazings and mirrored louvres are considered potentially useful devices for improving the daylight in a space due to their light redirecting properties [32]. These systems can offer some of the shading protection of venetian blinds with potentially greater redirection properties and less interrupted views outside. Some CFSs are fixed, others are moveable. Those that are fixed reduce one layer of complexity, allowing prediction of their performance to be determined without the confounding factors of variable transmission properties and/or the vagaries of user operation.
The optical properties of ordinary clear glazing and materials that have a matt finish are relatively easy to characterise for the purpose of lighting simulation. Less straightforward materials such as coated glazings and materials that produce part specular reflections are more challenging to both characterise and also to model accurately in a simulation. Tools such as Optics 5 and Window 6 can assist the creation of the necessary material description files for multilayer coated glazings [33]. The highlights resulting from even tiny specular reflections are an important part of the overall visual impression of a daylit space, however the total light energy resulting from these reflections is usually very small and can be ignored when predicting illuminance quantities. Specular reflections are only important for overall light transfer in a space when significant amounts of the entrant direct and diffuse light are reflected, e.g. when a mirror light shelf is present. Large scale reflecting/redirecting features such as light shelves or ‘skylight’ wells can be modelled using standard Radiance.
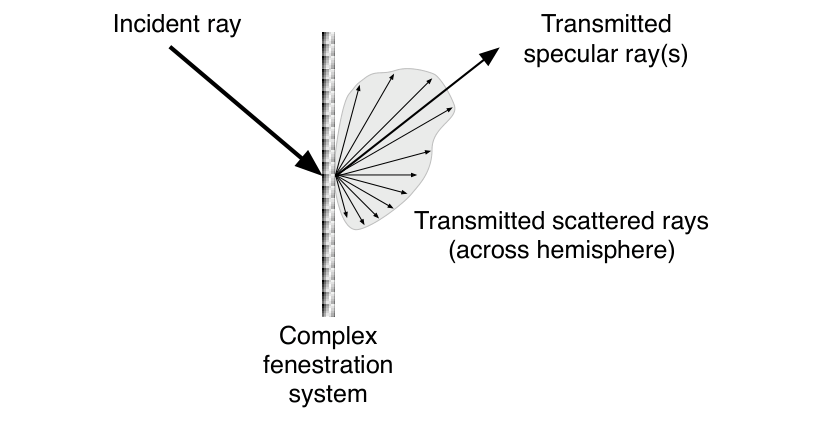
A major issue with complex fenestration systems however is that there is usually no straightforward relation between incident and transmitted light that can be determined a priori from simple, e.g. analytical, methods. Thus the optical properties of the CFS needs to be determined from either comprehensive measurements or, alternatively, simulation. For each light ray incident on a CFS there may be one or more strongly transmitted rays - which may be redirected in some fashion - together with in most cases a unique distribution of semi-diffuse or scattered light, Figure 1. Thus to fully characterise the material, the distribution in luminous output across the full hemisphere of transmitted rays needs to be determined for every incident direction [34]. This is the bi-directional transmission distribution function or BTDF [35]. The BTDF is challenging to characterise even for seemingly simple materials such as translucent glazing [36]. Another approach to characterisation of the BTDF is to predict it by simulation rather than by measuring it directly [37]. For this approach the geometric micro-structure of the material needs to be specified to a high degree of precision and the BTDF predicted using a forward ray-tracing program.
It is possible to model some CFSs without going to the lengths of determining the full BTDF if the transmission properties of the materials can be adequately represented by an analytical function. This has been achieved for certain types of laser cut panels [38] and the redirecting material Serraglaze [39]. A limited set of angular-dependent transmission measurements will still need to be taken to calibrate the analytical model.
Note that, although there are various approximations to model to the light transmission through venetian blinds, even these commonplace devices have complex optical properties. Both the slat angle and the coverage of venetian blinds can be varied continuously and independently of each other. For any given sun position, either of these factors has a considerable effect on the overall light transmission, i.e. the BTDF [40]. Venetian blinds therefore can be more difficult to model accurately than many of the ‘advanced’ CFSs because their BTDF is dependent on the user operation.
Light-pipes (i.e. tubular daylighting devices) offer a potentially effective daylighting strategy for low-rise buildings. The performance of a light pipe can be estimated using analytical methods or relatively simple software tools [41][42]. The detailed simulation of light pipe performance however requires the use of forward ray-tracing, i.e. it cannot be carried out using tools such as Radiance which use backwards ray-tracing.
Characterisation of BTDFs by either measurement or prediction is a highly specialised task, as is the use of these complex transmittance data in lighting simulations. There is considerable research to be carried out at all stages from characterisation to implementation in a software tool before their use in lighting simulation becomes commonplace. The development of libraries of BTDF databases for various products, based on standardised test procedures, will be necessary to enable full utilization of these products in design optimisation studies.
4 Example climate-based studies
Many issues raised thus far are currently the preserve of applied research, and it will be some time before they are fully addressed. These issues notwithstanding, a discussion of two recent climate-based evaluations will serve to illustrate the state-of-the-art of what can be achieved today.
4.1 The New York Times
The New York Times Headquarters (NYT) provides an interesting example of how daylight simulations were used to support decisions later in the design process during the construction phase of the building, rather than for early schematic design or meriting green building status.
Extensive Radiance simulations were used to assist the building owner and manufacturers in making informed decisions on the design and control of an automated roller shade and electric lighting control system for The New York Times Headquarters in the pre- and post-bid phases of the project [19]. A prior monitored field study in a full-scale mockup answered initial questions concerning technical feasibility and performance benefits of automated control. Simulations enabled extension of the monitored field study to the final building in its complex urban context (Figure 2).
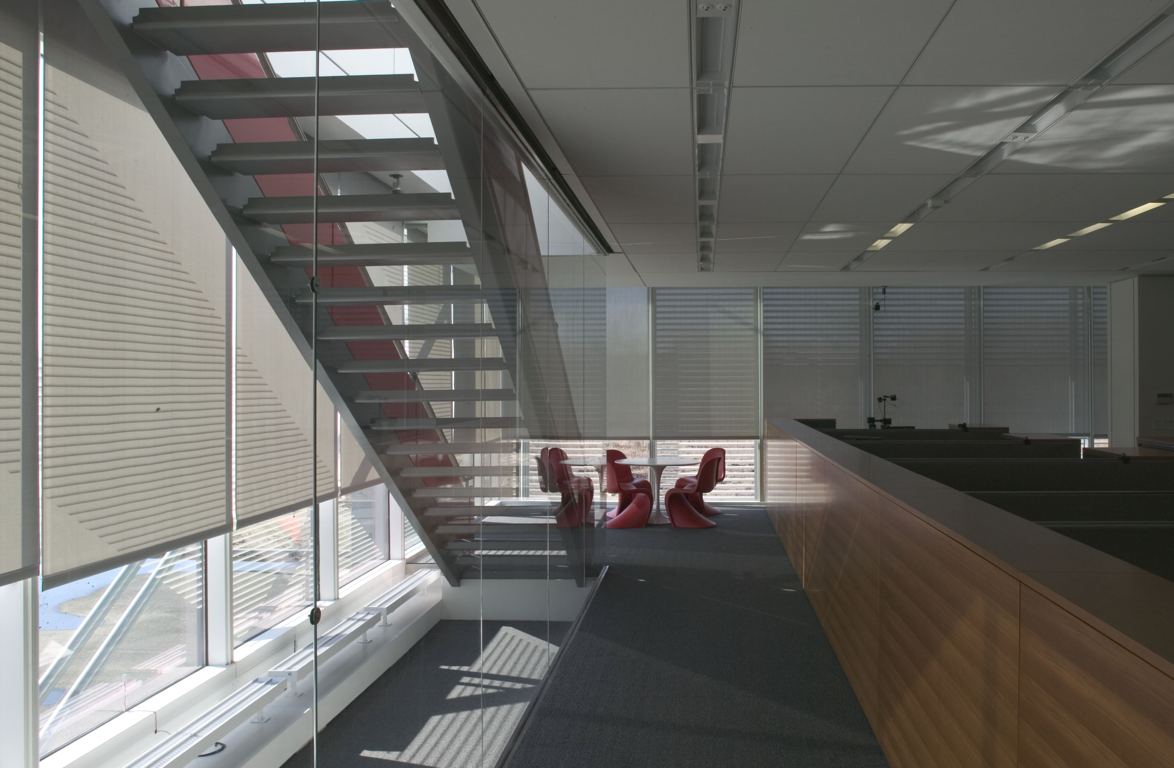
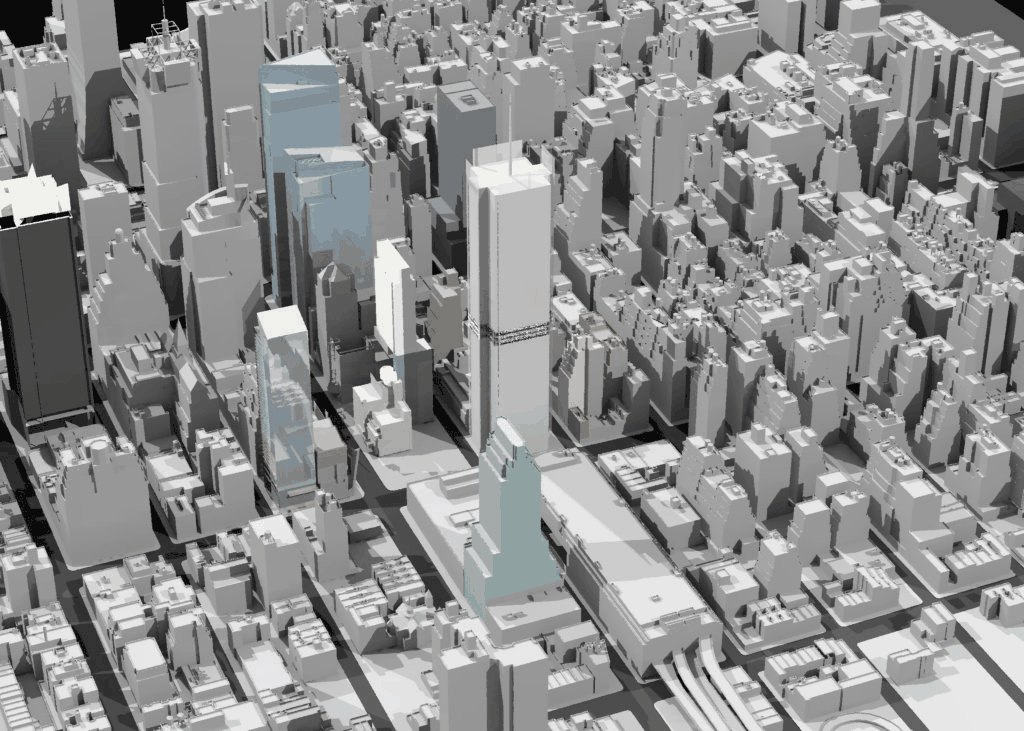
Radiance simulations were used for a variety of purposes, from understanding the effects of urban shadow on shade useage to assisting with pre-calibration of photosensor sensitivity in a complex daylit interior environment. Time-lapsed images enabled stakeholders (building owner and manufacturers) to visualize the daylit environment of the final building in its urban context with automated shade control and assess how well visual comfort (direct sun, surface luminance), daylight quality (illuminance level and distribution), and view were to be addressed by the system at different orientations and locations within the building. Inherently, a top-down roller shade compromises daylight when lowered to control direct sun and glare. Simulations were also used to determine whether minor adjustments to the shade control algorithm could increase interior daylight levels without compromising visual comfort. All of the above simulations were made for a discrete set of days, typically solstice and equinox days using CIE clear and overcast sky conditions and was sufficient for the directed purpose.
Annualized, climate-based Radiance simulations were conducted to more thoroughly assess comfort conditions and availability of view (defined as shade raised, not view through the fabric). The project teams somewhat frenetic discussions to derive practical procedures for analyzing comfort and consequent impacts on view and energy use is of greater relevance to this discussion of daylighting metrics in that they made preliminary overtures to derive a visual comfort-based metric similar to the thermal comfort percent people dissatisfied (PPD) metric. In the US, mechanical engineers have long relied on the metrics defined in the ASHRAE Standard 55 [43] to determine whether mechanical system designs will provide thermal environmental conditions acceptable to a majority of the occupants within the space. The predictive model is based on hundreds of field and laboratory studies that correlate physical measures to subjective response. Calculations are done for critical design conditions, that is for the 1% or 3% peak condition, e.g. for high levels of solar radiation that are exceeded for only 1% or 3% of the year. For more innovative designs (naturally ventilated, hybrid ventilation schemes, or large amounts of glazing), more detailed calculations are conducted: e.g., spatial distribution or temporal computations of PPD.
Conversely, predictive models for visual comfort are based on very few, limited field studies and consequently, there are no standards or requirements in place to ensure provision of visual comfort with daylighting designs: the occupant is simply expected to lower the shade. With the increased interest in daylighting and with the use of innovative systems, the need for robust predictive models for discomfort glare, in particular, is acute and was needed particularly for the NYT analysis. A simplified measure was used to evaluate comfort conditions based on a limited field study [44] and on calculations derived from a combination of comfort metrics (luminance ratios, daylight glare index, etc.): number of annual hours when the mean window luminance exceeded 2000 cd m−2. This measure helped the owner weigh the tradeoffs between number of hours of glare discomfort versus access to view and daylight. Calculations were made with the occupants’ seated field of view located in a worst case position close to the window in a direction normal to the window. The simulated data could have been evaluated using a metric more refined than the mean window luminance, e.g. the daylight glare index. At the time however, the available field data from occupant-based studies in daylit buildings did not convincingly support their use. Thus the analysis method was limited for practical reasons and ultimately confirmed what the academic and scientific community has known for quite some time: robust predictive models are sorely needed and procedures for their application must be defined and validated to make forward progress in the field of innovative daylighting.
4.2 Evaluation of daylighting for residential buildings
In a study commissioned by the VELUX company, the daylighting potential for two residential building types with various window configurations and external obstructions was determined for all combinations of six climates and eight building orientations. For each of the 480 unique combinations of building configuration, climate and orientation, quarter-hourly internal illuminances across various workplane surfaces were predicted for a period of a full year [45]. The two basic building types were based on realistic designs for modern single story residential buildings as might be found in both Europe and the USA. A full description is available in the technical report which is freely available for download [45].
The evaluation of daylighting potential was founded on the useful daylight illuminance (UDI) scheme where the degree of occurrence throughout the year of illuminances within certain ranges was determined [15]. Put simply, achieved UDI is defined as the annual occurrence of illuminances across the work plane that are within a range considered “useful” by occupants. The range considered “useful” is based on a survey of reports of occupant preferences and behaviour in daylit offices with user operated shading devices. Daylight illuminances in the range 100 to 500 lux are considered effective either as the sole source of illumination or in conjunction with artificial lighting. Daylight illuminances in the range 500 to around 2,000 or maybe 2,500 lux are often perceived either as desirable or at least tolerable. Note that these values are based on surveys carried out in non-residential, largely office buildings where daylight-originated glare on visual display devices is a common problem. Many of these surveys were carried out before LCD display panels - which are much less prone to glare than CRT screens - became commonplace. In contrast to office buildings, tasks in the domestic setting are not, of course, largely desk and display screen orientated. For these reasons, it is believed reasonable to recommend a higher upper limit for UDI achieved for the residential setting than for the office environment. Accordingly, the upper limit for preferred/tolerated daylight illuminance used for this study was 2,500 lux.
UDI achieved therefore is defined as the annual occurrence of daylight illuminances that are between 100 and 2500 lux. The UDI range is further subdivided into two ranges called UDI-supplementary and UDI-autonomous. UDI-supplementary gives the occurrence of daylight illuminances in the range 100 to 500 lux. For these levels of illuminance, additional artificial lighting may be needed to supplement the daylight for common tasks such as reading. UDI-autonomous gives the occurrence of daylight illuminances in the range 500 to 2500 lux where additional artificial lighting will most likely not be needed. The UDI scheme is applied by determining at each calculation point the occurrence of daylight levels where:
- The illuminance is less than 100 lux, i.e. UDI ‘fell-short’ (or UDI-f).
- The illuminance is greater than 100 lux and less than 500 lux, i.e. UDI supplementary (or UDI-s).
- The illuminance is greater than 500 lux and less than 2,500 lux, i.e. UDI autonomous (or UDI-a).
- The illuminance is greater than 2,500 lux, i.e. UDI exceeded (or UDI-e).
There was no attempt to model occupant behaviour through the use of blinds or shades. Thus the predicted daylighting potential as indicated by the UDI metrics was for the static building configuration. The hours of the day over which daylight availability was assessed was taken to be the period 08.00 to 20.00 hours. Thus, for several of the climates considered, there were times of darkness during the 4,380 hours across the 365 day year.
There are no official guidelines or recommendations yet for illuminance levels predicted using climate-based modelling. However, as noted, there is sufficient evidence in the published literature to indicate that occupants have a preference for illuminances in the UDI achieved range (i.e. 100 to 2,500 lux). For the purpose of this study, “good” daylighting was deemed to be that which offers high levels of useful daylight and where a significant part of the occurrence of useful daylight is due to illuminances that fall within the autonomous range (i.e. 500 to 2,500 lux). Additionally, the occurrence of UDI exceeded should be low.
The study revealed a huge variation in the predicted daylighting performance, as indicated by the UDI metrics, for the 480 cases evaluated. For any one building configuration there was a marked sensitivity of the UDI metrics to the locale (i.e. climate) and the building orientation. For example, the occurrence of illuminances in the UDI autonomous range (500 to 2,500 lux) ranged from under 3% to just over 50% of the occupied period for one of the building types studied. High occurrence of illuminances in the UDI-a range was taken to be an indicator of a low requirement for electrical lighting. This is probably a reasonable assumption for residential settings where occupants have considerable freedom to configure the environment to suit their preferences, e.g. to move seating away from areas that are considered either too bright or too gloomy.
4.3 Simulation Issues
The spaces evaluated for the NYT and VELUX studies approximate two extremes of architectural forms: high-rise offices and low-rise residential buildings. The NYT building did have some external shading in form of ceramic bars, but the overall shading effect was significantly less than that offered by many brise soleil. Although both evaluations were founded on metrics calibrated using data on human factors, the random effects of occupant behaviour (e.g. light switching and lowering blinds) were not modelled. The automated shades of the NYT building were modelled as a deterministic system responding to various control parameters. Any savings in electric lighting usage were determined or inferred from the provision of daylight rather than modelled explicitly.
The simulation component of both the NYT and the VELUX studies could be fairly described as equivalent to medium-sized research projects. Custom scripts and procedures needed to be written to prepare and manage the simulations, and also to post-process and distil the voluminous simulation data into summary metrics. Considerable enhancement and expansion of the existing research simulation software was required to carry out these projects. The scope and complexity of these evaluations might, at first, seem beyond what would be entailed in, say, an envisaged ‘typical’ evaluation using climate-based approaches. However, it is fair to state that, at present, there is no firm notion as to what constitutes a ‘typical’ evaluation.
A daylight simulation can be carried out using highly detailed 3D building models, such as are commonly prepared by architects and designers. Whilst many of the features in a CAD model may be superfluous for daylight simulation, the fenestration detail needs to be accurately modelled. Working with detailed CAD models for daylight simulation presents problems of integration with software suites that attempt to provide a unified interface with thermal and airflow modeling, since different material properties must be specified, such as surface reflection for lighting analysis, and thermal conductivity and capacitance for thermal analysis. In the past, building energy analysis has relied on greatly simplified 3D models, which do not support the fenestration or surface reflectance detail required for daylighting analysis. The integration of all these levels of analysis is a highly desirable goal, but will require considerable coordination across development groups, and likely involve compromises in precision of the analysis for some of the outputs.
The active shading systems used in the NYT building could well become more commonplace if they are found to perform well. Other manufacturers of daylighting products may well require studies comparable to the VELUX evaluation since the performance of daylighting systems are highly dependant on climate and building orientation, e.g. an ‘atlas’ of performance might be required. Codes and standards that specify daylighting performance are likely to require evidence of simulation results that demonstrate compliance. The simulation scenarios described above may turn out to be not so untypical of likely future applications. In which case, development of more accessible, user-friendly climate-based daylight modelling applications will be needed, with an inevitable compromise between precision/flexibility and ease-of-use. It is useful to distinguish between research-grade tools, which should support precise predictions that can be compared to monitored performance, and professional-grade tools, that will support early design analysis and compliance with codes and standards. The need for improved research-grade capabilities is immediate, while professional-grade tools should follow, once we are able to simplify many inputs with default assumptions that are better understood.
5 Daylighting and energy saving
5.1 Electric lighting energy use
Not yet addressed is the key issue of the potential to save energy through effective daylighting design. It seems to be generally believed that ‘good’ daylighting design will lead to reductions in electric lighting consumption, and also overall energy consumption. This belief results in part from common-sense notions and the pioneering work of Crisp and Hunt in the 1970s [46][47]. The potential for energy savings was usually based on extrapolating internal illuminance from daylight factors and cumulative daylight distributions, and then applying some model of lighting control [48]. Lighting control models based on manual switching were derived from observed patterns of behaviour [49][50]. It was realised early on that occupant control alone was unlikely to lead to significant energy savings for the simple reason that lights were likely to remain switched on even when there was plentiful daylight. Some form of timed switching and/or automatic control were needed to ensure savings, and a number of largely theoretical formulations for occupancy-sensor and photoelectric control of lighting were devised [46]. The design and artificial lighting of non-domestic spaces has changed considerably over the last thirty years, and some of the findings noted in occupancy studies carried out three or more decades ago may not necessarily hold today.
Post-occupancy studies carried out in real buildings have shown that the actual energy performance is invariably markedly worse than that predicted at the design stage. The landmark PROBE study determined many of the reasons for this [51]. Some of the findings specific to lighting controls are noted below:
Default states which are non-optimal, but cause the least trouble for occupants and management. The most common of these is blinds closed lights on, which has undermined many a daylight and lighting control strategy.
Photocells used for perimeter dimming ...were also confused by light redirected upwards onto them from the venetian blind slats, requiring control setpoints to be raised, so reducing the benefits of daylight-linked dimming.
The ratio of predicted to realized energy savings is defined as the “realized savings ratio” or RSR. Studies of automatic photocontrol performance in the United States have shown very high RSRs for simple toplit spaces, and much lower RSRs for more complex sidelit spaces [5]. Predicting the performance of an automated lighting control system is a function of many factors, including not only space design and daylight availability, but also lighting system design, control settings, commissioning history, and occupant override behavior.
Thus, the simplest metric of lighting energy use may be “full-load equivalent hours”, or the percentage of electric lighting system design target illumination (e.g. 500 lux), with a theoretically perfect dimming response, displaced by the available daylight. Such a metric describes the potential for electric lighting displacement, rather than predicting final energy savings. In combination with an estimated RSR, it can also be usefully input into other energy analysis tools to study impacts on heating and cooling via electric lighting use reduction.
| Source | Luminous efficacy [lm/W] |
|---|---|
| Sunlight | 70 - 105 |
| Clear blue skylight | 130 |
| Overcast skylight | 110 |
| Global daylight | 105 |
| Incandescent bulb | 15 |
| Compact fluorescent | 57 - 72 |
| T5 linear fluorescent | 70 - 100 |
5.2 Daylight and whole building energy use
Daylight is merely the visible part of the radiant energy that enters through windows. Furthermore, the bulk of the daylight energy that enters a space is converted into thermal energy after just a few reflections. Many office buildings in moderate climates now have air conditioning largely due to the high internal gains. In warmer climates cooling may be needed for large parts of the year.
When cooling is needed in a space, both the use of electric lighting and the ingress of daylight will each add to the cooling load. The relation between the visible part and the total energy content associated with electromagnetic radiation is the luminous efficacy. It is the ratio of luminous flux (in lumens) to power (usually measured in watts) and therefore has units of lumens per watt [52]. For artificial light, it is the ratio of luminous flux emitted from a light source to the electric power consumed by the source. To provide the most illumination whilst introducing the least thermal energy into a space requires a source with a high luminous efficacy (Table 1). The large range shown for sunlight is due mainly to varying solar altitude, though variations in atmospheric conditions will have an effect also. For a given quantity of illumination, light from clear blue skies delivers the least amount of heat gain. Note that the values given in Table 1 are for the radiation received directly from the source, outside of any glazing material and before reflection. The use of spectrally selective glazing materials radically changes these values, and can improve the luminous efficacy of daylight sources dramatically.
Daylighting could lead to a net increase in energy consumption if the additional cooling load due to daylight (i.e. including the solar component) exceeds the energy saved due to reduced electric lighting, or if the net heat gains and losses through the fenestration do not compensate for the lighting energy saved. In fact, an all too common scenario in over-glazed buildings is where the blinds are down to control glare and the lights are on. This leads to the undesirable combination of high solar gains (blinds reject only a small part of the energy once it has passed through the glazing) and no ‘daylight benefit’ in terms of displaced lighting energy or daylight provision. A full consideration of the potential for daylighting to save energy should, at some point, account also for the thermal effects of daylight. In which case, daylight metrics may need to be calibrated against criteria for whole building energy use and not just the potential to reduce the energy consumed for electric lighting.
Coupling of dynamic thermal and climate-based daylight modelling has been demonstrated by a number of researchers [53], and daylight prediction capability has been added to some popular thermal simulation programs such as EnergyPlus and eQuest/DOE2.1 [54]. The clear advantage of these combined analysis programs is that, in principle, they can account for dynamic interactions between the climate inputs, occupancy schedules, and the building system controls. For example, whether solar gains through a window are a net positive or negative effect at any given point in time depend upon whether the building is currently requiring heating or cooling, determined by such factors as current outdoor temperature, ventilation needs, other thermal loads, thermal mass and insulation properties, and the operation of the HVAC system.
As discussed earlier, efforts to tightly couple simulation modalities, i.e. where a common building model is used for both, inevitably leads to some compromises. In the case of the thermal modeling programs discussed above, the current daylighting modeling capabilities are greatly simplified (e.g. using the split-flux method), and the geometric details of the fenestration system are limited.
6 Summary and future prospects
The computational mechanics of climate-based daylight modelling (CBDM) are reasonably well advanced, though there are no accepted methodological guidelines yet for applying the technique. All the physical quantities (e.g. visual field, horizontal illuminance etc.) noted in Section 3.1 can, with varying degrees of difficulty, be predicted to high degrees of accuracy using validated lighting simulation techniques. Most of the existing software implementations are based on the Radiance system [55]. These software range from purely in-house research tools (see [24][56][57]) to end-user versions such as DAYSIM from the NRC, Canada [58] and SPOT [16]. It is fair to note that all implementations, including the ‘end-user’ DAYSIM system, require operation by a knowledgeable user that is at least competent if not expert with the Radiance system, and already has a well developed intuitive understanding of daylighting performance. Additionally, the user should be reasonably familiar with the science of climate measurement, the handling/manipulation of climate files and the analysis/reduction of voluminous output data.
The number of active researchers in this field is small but steadily growing. In 2007 a subcommittee for the development of daylight metrics was established by the Illuminating Engineering Society of North America, which has provided oversight to the Daylight Metrics Project discussed earlier. The goal of the subcommittee is to guide the development of daylight metrics in North America and publish recommendations for their use. In December 2008 the Board of Administration of the International Commission on Illumination approved the formation of Technical Committee 3-47: Climate-Based Daylight Modelling. The Technical Committee comprises key international researchers and practitioners active in the field. The terms of reference are as follows [59]:
- To describe the state-of-the-art in CBDM and determine levels of research activity.
- To identify themes in ongoing areas of CBDM research and forecasting of future developments.
- To identify key areas of core or supporting research which are either lacking or with insufficient activity.
- To determine key application areas for CBDM and the required data pre-requisites.
- To codify an authoritative workflow for CBDM that is compliant with agreed quality assurance criteria.
- To provide guidance on the application of CBDM to predict emerging daylight metrics.
The activities and outputs of this TC will serve to define and make authoritative the practice of climate-based daylighting modelling, and therefore underpin the computational basis of the ‘engines’ that will be used to predict daylight metrics.
Whilst a few candidate metrics have been proposed, it remains to be determined if any one or more of them can address all the stakeholder requirements liusual contasted in Section 2. Determining the relation between visual comfort as experienced and what can be objectively measured or simulated has proved challenging, though progress is being made using high dynamic range capture techniques to more fully quantify the luminous environment [60][61]. Implementing these visual comfort models into lighting simulation programs is an ongoing area of research [56].
Determining target values for daylight metrics that satisfy both visual and energy criteria is perhaps the most challenging task ahead. As discussed in Section 5, energy considerations should ideally make account of the impact that daylight has on heating/cooling load as well as on electric lighting usage. To this end, it is vital that post-occupancy studies are carried out to both validate and calibrate the predictions obtained from daylight simulations, and provide information that allows corrections for observed user behavior and system performance. The PROBE study showed that, even for the more established techniques such as dynamic thermal simulation, actual building performance often differed markedly from what was predicted [62].
Even without commonly agreed target values for the candidate metrics, the climate-based daylight studies carried out to date on real buildings have produced valuable insights and delivered tangible design advice. These studies are to be encouraged because they subject CBDM to tests under real-world conditions that may not be encountered in academic projects.
Acknowledgements
The Daylight Metrics Project, led by Lisa Heschong, with Mudit Saxena and Seth Wayland of the Heschong Mahone Group, and team members Chistoph Reinhardt of Harvard University (formerly National Research Canada), Marilyne Anderson of MIT, Kevin Van den Wymelenberg of the University of Idaho, Joel Loveland and Chris Meeks of the University of Washington, is supported by funding from the California Energy Commission, the Northwest Energy Efficiency Alliance, the New York State Energy Research and Development Authority, and National Research Canada. The project supports the mission of the Daylighting Metrics Subcommittee of the Illuminating Engineering Society of North America. LBNL contributions were supported by the Assistant Secretary for Energy Efficiency and Renewable Energy, Building Technologies Program, of the U.S. Department of Energy under Contract No. DE-AC02-05CH11231. This paper was written in support of the activities of CIE TC 3-47. Comments from the referees and the Editor are gratefully acknowledged.
References
- Building Research Establishment. BREEAM - The BRE Environmental Assessment Method. http://www.breeam.org.
- The U.S. Green Building Council. LEED: Leadership in Energy and Environmental Design. http://www.usgbc.org/LEED.
- R. G. Hopkinson. Architectural Physics - Lighting. Her Majesty’s Stationery Office, London, 1963.
- P. J. Littlefair. Predicting lighting energy use under daylight linked lighting controls. Building Research & Information, 26(4):208–222, 1998.
- Heschong Mahone Group. Sidelighting photocontrols field study. Final Report to Southern California Edison Co, Pacific Gas & Electric Company and Northwest Energy Efficiency Alliance, 2006.
- Heschong Mahone Group. Windows and Offices: A Study of Office Worker Performance and the Indoor Environment. L. Heschong, Editor. CEC, California Energy Commission, 2003.
- Commission for Architecture and the Built Environment. The role of hospital design in the recruitment, retention and performance of NHS nurses in England. CABE, pages 120–124, 2004.
- California Energy Commission. 2008 Building Energy Efficiency Standards for Residential and Nonresidential Buildings. 2008.
- Ann R. Webb. Considerations for lighting in the built environment: Non-visual effects of light. Energy and Buildings, 38(7):721–727, 2006.
- J. Mardaljevic. Examples of climate-based daylight modelling. CIBSE National Conference 2006: Engineering the Future, 21-22 March, Oval Cricket Ground, London, UK, 2006.
- D. B. Crawley, L. K. Lawrie, F. C. Winkelmann, W. F. Buhl, Y. J. Huang, C. O. Pedersen, R. K. Strand, R. J. Liesen, Daniel E. Fisher, M. J. Witte, and J. Glazer. EnergyPlus: creating a new-generation building energy simulation program. Energy and Buildings, 33(4):319–331, 2001.
- J. Mardaljevic. Time to see the light. Building Services Journal, September:59–62, 2006.
- J. Mardaljevic. Simulation of annual daylighting profiles for internal illuminance. Lighting Research and Technology, 32(3):111–118, 1 2000.
- C. F. Reinhart and S. Herkel. The simulation of annual daylight illuminance distributions – a state-of-the-art comparison of six RADIANCE-based methods. Energy and Buildings, 32(2):167–187, 2000.
- A. Nabil and J. Mardaljevic. Useful daylight illuminances: A replacement for daylight factors. Energy and Buildings, 38(7):905–913, 2006.
- C. F. Reinhart, J. Mardaljevic, and Z. Rogers. Dynamic daylight performance metrics for sustainable building design. Leukos, 3(1):7–31, 2006.
- F. C. Winkelmann and S. Selkowitz. Daylighting simulation in DOE-2: Theory, validation, and applications. International Building Performance Simulation Association, pages 326–336, 1985.
- R Koti and M Addison. An Assessment of Aiding DOE-2’s Simplified Daylighting Method With DAYSIM’s Daylight Illuminances. Solar 2007, American Solar Energy Society, Cleveland, July 7-12, 2007.
- E. S. Lee, S. E. Selkowitz, G. D. Hughes, R. D. Clear, G. Ward, J. Mardaljevic, J. Lai, M. N. Inanici, and V. Inkarojrit. Daylighting the New York Times headquarters building. Lawrence Berkeley National Laboratory. Final report LBNL-57602, 2005.
- Heschong Mahone Group. Daylight Metrics Project - internal documents. http://www.h-m-g.com/DaylightPlus/Daylight Metrics.htm, 2008.
- J. Mardaljevic and K. Lomas. A simulation based method to evaluate the probability of daylight glare over long time periods and its application. CIBSE National Lighting Conference: 5-8 April, Lancaster University, UK, pages 282–291, 1998.
- W. K. E. Osterhaus. Discomfort glare assessment and prevention for daylight applications in office environments. Solar Energy, 79(2):140–158, 2005.
- P. R. Tregenza and I. M. Waters. Daylight coefficients. Lighting Research and Technology, 15(2):65–71, 1 1983.
- J. Mardaljevic. Daylight Simulation: Validation, Sky Models and Daylight Coefficients. PhD thesis, De Montfort University, Leicester, UK, 2000.
- J. Mardaljevic and A. Nabil. Electrochromic glazing and facade photovoltaic panels: a strategic assessment of the potential energy benefits. Lighting Research and Technology, 40(1):55–76, 2008.
- E. Vine, E. Lee, R. Clear, D. DiBartolomeo, and S. Selkowitz. Office worker response to an automated venetian blind and electric lighting system: a pilot study. Energy and Buildings, 28(2):205–218, 1998.
- L. Roche, E. Dewey, and P. Littlefair. Occupant reactions to daylight in offices. Lighting Research and Technology, 32(3):119–126, 1 2000.
- L Roche. Summertime performance of an automated lighting and blinds control system. Lighting Research and Technology, 34(1):11–25, 2002.
- Christoph F. Reinhart. Lightswitch-2002: a model for manual and automated control of electric lighting and blinds. Solar Energy, 77(1):15–28, 2004.
- D. Bourgeois, C. F. Reinhart, and I. Macdonald. Adding advanced behavioural models in whole building energy simulation: A study on the total energy impact of manual and automated lighting control. Energy and Buildings, 38(7):814–823, 2006.
- R Embrechts and C van Bellegem. Increased energy savings by individual light control. Right Light 4, Copenhagen, 1:179–182, 1997.
- M. E. Aizlewood. Innovative daylighting systems: An experimental evaluation. Lighting Research and Technology, 25(4):141–152, 1 1993.
- Optics5. Lawrence Berkeley National Laboratory. http://windows.lbl.gov/materials/optics5.
- Peter Apian-Bennewitz and Jochen von der Hardt. Enhancing and calibrating a goniophotometer. Solar Energy Materials and Solar Cells, 54(1-4):309–322, 1998.
- M. Andersen, L. Michel, C. Roecker, and J. L. Scartezzini. Experimental assessment of bi-directional transmission distribution functions using digital imaging techniques. Energy and Buildings, 33(5):417–431, 2001.
- Christoph F. Reinhart and Marilyne Andersen. Development and validation of a Radiance model for a translucent panel. Energy and Buildings, 38(7):890–904, 2006.
- M. Andersen, M. Rubin, R. Powles, and J. L. Scartezzini. Bi-directional transmission properties of venetian blinds: experimental assessment compared to ray-tracing calculations. Solar Energy, 78(2):187–198, 2005.
- P. J. Greenup, I. R. Edmonds, and R. Compagnon. Radiance algorithm to simulate laser-cut panel light-redirecting elements. Lighting Research and Technology, 32(2):49–54, 1 2000.
- J. Mardaljevic. Climate-based daylight modelling for evaluation and education. VELUX Daylight Symposium, Bilbao, Spain. 6-7 May, 2007.
- J. Breitenbach, S. Lart, I. Langle, and J. L. J. Rosenfeld. Optical and thermal performance of glazing with integral venetian blinds. Energy and Buildings, 33(5):433–442, 2001.
- D.J. Carter. The measured and predicted performance of passive solar light pipe systems. Lighting Research and Technology, 34(1):39–51, 2002.
- David Jenkins, Tariq Muneer, and Jorge Kubie. A design tool for predicting the performances of light pipes. Energy and Buildings, 37(5):485–492, 2005.
- ASHRAE. Standard 55: Thermal Environmental Conditions for Human Occupancy. American Society of Heating, Refrigerating and Air-Conditioning Engineers, Inc., Atlanta, 2004.
- R. D. Clear, V. Inkarojrit, and E. S. Lee. Subject responses to electrochromic windows. Energy and Buildings, 38(7):758–779, 2006.
- J. Mardaljevic. Climate-Based Daylight Analysis for Residential Buildings. Technical report, IESD, De Montfort University, Leicester Download from http://www.thedaylightsite.com/, 2008.
- V. H. C. Crisp. Preliminary study of automatic daylight control of artificial lighting. Lighting Research and Technology, 9(1):31–41, 1977.
- D. R. G. Hunt. Simple expressions for predicting energy savings from photo-electric control of lighting. Lighting Research and Technology, 9(2):93–102, 1977.
- D. R. G. Hunt. Improved daylight data for predicting energy savings from photoelectric controls. Lighting Research and Technology, 11(1):9–23, 1979.
- V. H. C. Crisp. The light switch in buildings. Lighting Research and Technology, 10(2):69–82, 1978.
- D. R. G. Hunt. Predicting artificial lighting use - a method based upon observed patterns of behaviour. Lighting Research and Technology, 12(1):7–14, 1980.
- Bill Bordass, Robert Cohen, Mark Standeven, and Adrian Leaman. Assessing building performance in use 3: energy performance of the probe buildings. Building Research & Information, 29(2):114–128, 2001.
- P. J. Littlefair. The luminous efficacy of daylight: a review. Lighting Research and Technology, 17(4):162–182, 12 1985.
- M. Janak and I. Macdonald. Current state-of-the-art of integrated thermal and lighting simulation and future issues. International Building Performance Simulation Association, pages 1173–1180, 1999.
- William L. Carroll and Robert J. Hitchcock. DELIGHT2 Daylighting Analysis in EnergyPlus: Integration and Preliminary User Results. International Building Performance Simulation Association, 2005.
- G. Ward Larson and R. Shakespeare. Rendering with Radiance: The Art and Science of Lighting Visualization. San Francisco: Morgan Kaufmann, 1998.
- J. Wienold. Dynamic simulation of blind control strategies for visual comfort and energy balance analysis. International Building Performance Simulation Association, pages 1197–1204, 2007.
- L. Fernandes, G. Ward, and E. S. Lee. Radiance-mathematica optimization of electrochromic operations for occupant comfort and non-energy provisions. Lawrence Berkeley National Laboratory. Paper LBNL-59821.
- Christoph F. Reinhart and Oliver Walkenhorst. Validation of dynamic radiance-based daylight simulations for a test office with external blinds. Energy and Buildings, 33(7):683–697, 2001.
- J. Mardaljevic. Conclusion to CIE Reportership R3-26: Climate-Based Daylight Analysis. http://www.cie.co.at/div3/docs/mardaljevic-cie-rs.pdf, 2008.
- J. Wienold and J. Christoffersen. Evaluation methods and development of a new glare prediction model for daylight environments with the use of ccd cameras. Energy and Buildings, 38(7):743–757, 2006.
- B. Painter, D. Fan, and J. Mardaljevic. Minimally intrusive evaluation of visual comfort in the normal workplace. 7th International Radiance Scientific Workshop, 30-31 October Ecole d’ingénieurs et d’architectes, Fribourg, Switzerland, 2008.
- PROBE Special Issue: Post-occupancy Evaluation. Building Research & Information, 29(2), 2001.
- J. Mardaljevic. Sky model blends for predicting internal illuminance: a comparison founded on the BRE-IDMP dataset. Journal of Building Performance Simulation, 1(3):163–173, 2008.
- R. Perez, R. Seals, and J. Michalsky. All-weather model for sky luminance distribution–preliminary configuration and validation. Solar Energy, 50(3):235–245, 1993.
Appendix 1 - Components of daylight
The schematic shown in Figure 3 illustrates the components of daylight and their relation to the two modelling approaches described in this paper. Daylight comprises light from both the sun and the sky. Light may arrive at a point in a space either directly or indirectly from the luminous source. Direct illumination generally results from having an unobstructed view of the source. Indirect illumination is when the light arrives at the point following one or more reflections. Thus, strictly speaking, there are direct and indirect components of illumination from both the sun and the sky (Figure 3). Although the sun and the sky are both luminous sources, direct sunlight when present is given special consideration because of the small angular size of the sun and its potentially large contribution to illumination (and also its heating effect). Thus illumination from direct sunlight is commonly referred to as “direct light”. In contrast, light from the sky - arriving either directly or indirectly - is commonly referred to as “diffuse light”. Sunlight that has undergone one or more diffuse reflections is also commonly referred to as “diffuse light”. Note, the mode of reflection of the direct sunlight is important: a specular (or “mirror”) reflection of sunlight will produce a redirected beam of direct light rather than diffuse light. For reflections (and transmissions) that are part-specular and part-diffuse, the distinction between direct and diffuse light can become lost. Reflections can occur either internal or external to the space under consideration.
As noted, the daylight factor considers only the illuminance from a single, static overcast sky condition. And then normalises it to the unobstructed external value to produce a relative measure of illumination, usually expressed as a percentage, e.g. a 2% daylight factor. Climate-based daylight modelling delivers absolute values for luminous quantities, e.g. illuminance, and accounts for the totality of illumination, i.e. light from the sun and the sky received directly and indirectly following reflection(s). The standardised climate files usually contain hourly averaged values for diffuse horizontal illuminance and direct normal illuminance. The sky and sun conditions are derived from these data for each time-step in the simulation. The luminous output of the sun is based directly on the value for direct normal illuminance, and the sun position is determined from the time-stamp. The sky luminance distribution is either inferred from the illuminance data in the climate file using a sky model blending function [63], or generated automatically using, say, the Perez All-Weather model [64].
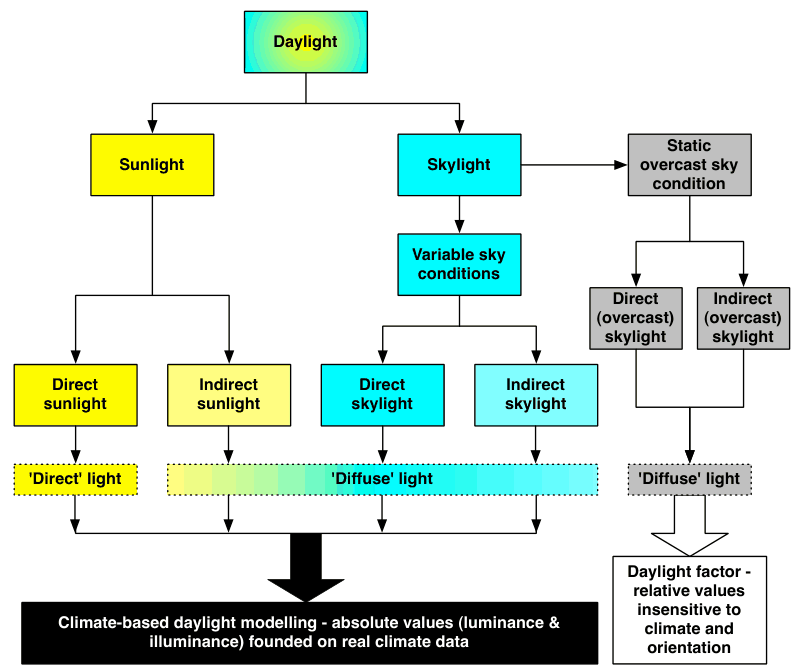
Some CBDM software can output, for example, total illuminance as four illuminance components, i.e. direct sunlight, indirect sunlight, direct sky light and indirect skylight. Analysed independently and together, these data can help to isolate and finely quantify effects such as the ‘reflective efficiency’ of light wells, light shelves and other features that serve to temper the luminous environment through the shading and redirection of light.
This document is a work of the U.S. government or a government-funded laboratory and is reproduced in full for research and educational purposes. Logistics Lighting has re-formatted it for readability; the wording is the original author's. Report an error at info@logisticslighting.com.
← Back to the Daylighting Library