
LBNL meta-analysis of 240 savings estimates from 88 studies finds lighting controls save 24% (occupancy) to 38% (combined strategies) of lighting energy, and full ASHRAE 90.1-2010 adoption could cut national commercial lighting energy about 19%.
Work funded by the U.S. Department of Energy and produced by Lawrence Berkeley National Laboratory, reproduced in full with attribution. Original report: Quantifying National Energy Savings Potential of Lighting Controls in Commercial Buildings (LBNL, May 2012).
Quantifying National Energy Savings Potential of Lighting Controls in Commercial Buildings
Alison Williams, Barbara Atkinson, Karina Garbesi and Francis Rubinstein
Energy Analysis Department, Environmental Energy Technologies Division, Lawrence Berkeley National Laboratory, Berkeley, CA 94720
Erik Page, Erik Page & Associates, Inc.
May 2012
The work described in this article was funded by the U.S. Department of Energy’s Office of Energy Efficiency and Renewable Energy, Building Technologies Program under Contract No. DE-AC02-05CH11231.
Disclaimer
This document was prepared as an account of work sponsored by the United States Government. While this document is believed to contain correct information, neither the United States Government nor any agency thereof, nor The Regents of the University of California, nor any of their employees, makes any warranty, express or implied, or assumes any legal responsibility for the accuracy, completeness, or usefulness of any information, apparatus, product, or process disclosed, or represents that its use would not infringe privately owned rights. Reference herein to any specific commercial product, process, or service by its trade name, trademark, manufacturer, or otherwise, does not necessarily constitute or imply its endorsement, recommendation, or favoring by the United States Government or any agency thereof, or The Regents of the University of California. The views and opinions of authors expressed herein do not necessarily state or reflect those of the United States Government or any agency thereof or The Regents of the University of California.
Abstract
Lighting has the largest estimated technical potential for energy savings of any U.S. building end-use. A significant fraction of that potential is believed to lie in lighting system controls. While controls are incorporated in national model building codes, their adoption and enforcement are spotty, and controls have been largely ignored in energy efficiency standards, leaving much potential untapped. The development of sound energy policy with respect to lighting controls depends on improved quantification of potential savings. Researchers have been quantifying energy savings from lighting controls in commercial buildings for more than 30 years, but results vary widely. This meta-analysis of energy savings potential used 240 savings estimates from 88 published sources, categorized into daylighting strategies, occupancy-based strategies, personal tuning, and institutional tuning. Beginning with an average of savings estimates based on the entire literature, this research added successive analytical filters to identify potential biases introduced to the estimates by different analytical approaches. We obtained relatively robust final estimates of average savings: 24% for occupancy, 28% for daylighting, 31% for personal tuning, 36% for institutional tuning, and 38% for combined approaches. Using these data and estimates of current and full penetration of controls, we calculated national energy savings potential on the order of 19%.
Introduction
Lighting systems have the largest known potential of any appliance to reduce United States energy use (Desroches and Garbesi 2011). Lighting represents approximately one-third of electricity use in commercial buildings and more than one-half in lodging and retail (DOE n.d.). As a result, there is significant interest in reducing lighting energy use through more efficient lighting systems. The National Electrical Manufacturers Association (NEMA) has argued that controls have greater potential for energy savings in major applications than do increases in source efficacies (DOE 2011). However, lighting controls are not incorporated in federal energy conservation standards and while incorporated through state and local building codes, adoption and enforcement are spotty.
Energy savings from some system components, such as replacing T12s with T8s, can be fairly easily quantified and guaranteed, but savings from controls that turn lights off or down when not needed depend on numerous factors including application, site orientation and occupation, building design, interior reflectances, occupant behavior, and tuning and configuration during installation and commissioning, making savings less easy to predict. Researchers have been quantifying these savings for more than 30 years, but no comprehensive research review of the studies on controls has been done before. This makes it hard to understand the big picture of the opportunities of controls because the individual studies have been very diverse in their goals, methods, coverage, and results. A few papers have provided limited overviews of lighting controls studies in commercial buildings. Three of these reviews focused solely on occupancy sensors (Guo et al 2010; LRC 2003; VonNeida et al 2000). The two reviews of savings from systems other than occupancy sensors (NBI 2011; SCE 2008) provide only one to six savings estimates per control type.
The purpose of this meta-analysis is to derive average energy savings per control type for commercial buildings based to the extent possible on all available data. Because these studies do not generally use common parameters, we utilize a range of analytical filters to isolate the effect of controls from those of other lighting system modifications and to estimate the savings by control type and building type. Finally, we apply these energy savings numbers to current energy use using estimates of full penetration of controls (assuming instant adoption of ASHRAE 90.1-2010), to estimate the national energy savings potential.
Estimating Lighting Controls Savings
Literature Search and Data Organization
Our investigation of lighting controls savings potential was based on a search for primary data sources that provide energy savings in percentage terms from studies of lighting controls in interior commercial building applications or present baseline and test case energy use from which we could calculate percentage savings (Williams et al. 2011). In total, we identified 88 papers that met these criteria with dates ranging from 1982 to 2011. We compiled data from the 88 papers into a searchable database in an Excel spreadsheet format. Each row of the spreadsheet (data record) represented a unique estimation of energy savings from controls. Every paper was represented by at least one row, but multiple rows were used if the paper presented energy savings for more than one space type or control configuration (based on whether the control was dimming, on-off, or both, and whether the control was automatic or manual). Ultimately this process yielded 240 records of unique controls-related energy savings estimates from the 88 papers and a database that includes more than 40 independent columns. We based the primary data organization on the four major controls strategies defined in Table 1, as well as a “multiple approach” category.
| Strategy | Definition | Relevant Technologies |
|---|---|---|
| Occupancy | Adjustment of light levels according to the presence of occupants | occupancy sensors, time clocks, energy management system |
| Daylighting | Adjustment of light levels automatically in response to the presence of natural light | photosensors |
| Personal tuning | Adjustment of individual light levels by occupants according to their personal preferences; applies, for example, to private offices, workstation-specific lighting in open-plan offices, and classrooms | dimmers, wireless on-off switches, bi-level switches, computer-based controls, pre-set scene selection |
| Institutional tuning | (1) Adjustment of light levels through commissioning and technology to meet location-specific needs or building policies; or (2) provision of switches or controls for areas or groups of occupants; examples of the former include high-end trim dimming (also known as ballast tuning or reduction of ballast factor), task tuning, and lumen maintenance | dimmable ballasts, on-off or dimmer switches for non-personal lighting |
Analytical Filters and Results
Overall. As a starting point, we calculated overall average energy savings by control strategy for all studies in the spreadsheet, irrespective of exactly what the savings represented. Each row in our spreadsheet included an average savings either directly from the paper, calculated from a minimum and maximum provided in the paper, or calculated based on a range of other variables, such as window orientation and occupancy sensor delay time. As such, we calculated the overall average savings for the meta-analysis as a simple average of the average savings in each row.
Figure 1 shows the average savings by control strategy as well as the standard deviation and minimum and maximum values. For individual control types, average savings range from 30% for occupancy to 41% for daylighting. Note that the institutional and personal tuning sample sizes are small. Throughout this paper, the savings figures for each filter will be shown with the control strategies in the same order to demonstrate changes between filters.
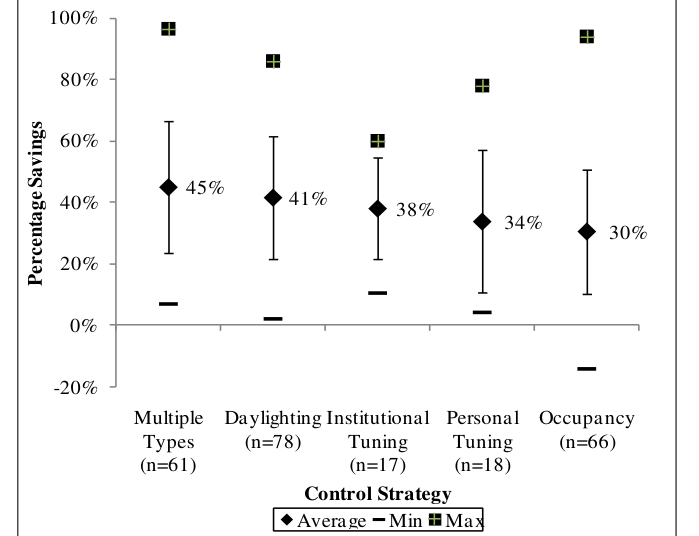
The savings shown in Figure 1 represent a wide range and include cases where the savings are negative. Throughout this analysis, we checked for outliers in the dataset in an effort to identify data that would not represent realistic potential energy savings and to narrow the range as appropriate. In the overall data, there appear to be outliers on the low end. However, these are generally from actual installations, and, in the negative case, occupants had previously been diligent about turning off lights but no longer did so after installation of controls. We believe this provides a legitimate potential result that may occur with occupancy sensor installation. Some other low savings numbers occur from strategies implemented in combination with other strategies, so that the savings attributed to any one strategy may be smaller than they would be if implemented alone. In addition, some low savings may result from less than ideal installations, such as daylighting in areas with little practical daylight illumination. However, we think that many of the numbers on the high end are actually outliers, and we review the maximum savings after each filter to identify whether outliers have been removed. Note that we relied on the filtering process to remove outliers rather than removing any arbitrarily.
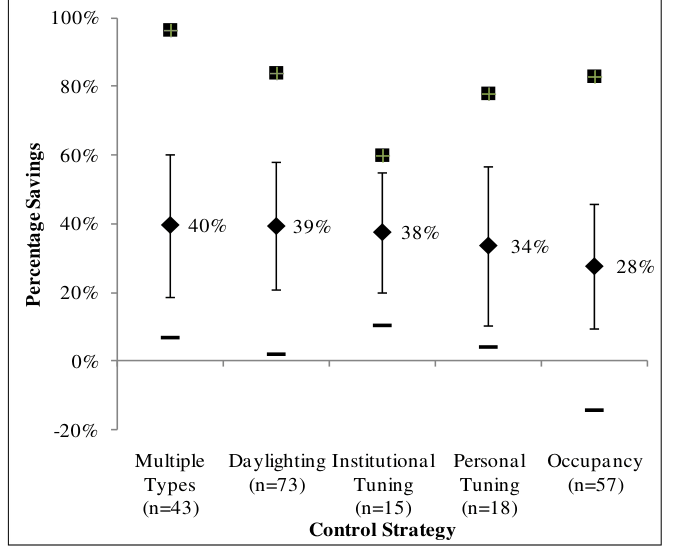
Savings for lighting controls only. For the first filter, we screened out savings data that included not only savings from controls but also from lamp or luminaire retrofits. This filter left us with data points that represented savings from lighting controls only. Figure 2 shows the average savings following this first filter. Savings for individual control types range from 28% for occupancy to 39% for daylighting, representing a very small correction. Note that this filter does not remove many of the high outliers.
Savings for lighting energy only. For the next filter, we examined what the savings represented, as we wanted to include studies that represented lighting energy savings only. We removed data points that represented savings as a fraction of total building energy or included heating, ventilation, and air conditioning (HVAC) savings as opposed to lighting savings only. We also removed data points that represented a non-comparable savings type, such as wasted light hours and energy costs. However, if the presented units were equivalent to energy; for example if occupancy sensors saved X% of lighting hours and there was no apparent change to power, the savings were considered equivalent to energy savings.
Note that within energy savings, savings may still represent different things (i.e. annual vs. daily, weekday core hours only vs. 24/7, baseline of lights full on vs. occupancy profile). However, we did not attempt to filter or standardize further on this variable. Many of the papers did not provide clear information on all details, and many different hour ranges were used for core hours. In addition, in some building types, evaluating savings from core hours may account for nearly all the savings, while, in other building types, savings may accrue mostly after hours, making a 24-hour baseline important. With these examples, it does not seem critical to use only studies with certain definitions of energy savings, although standardization of some of these aspects in individual studies could lead to more robust conclusions in future meta-analyses.
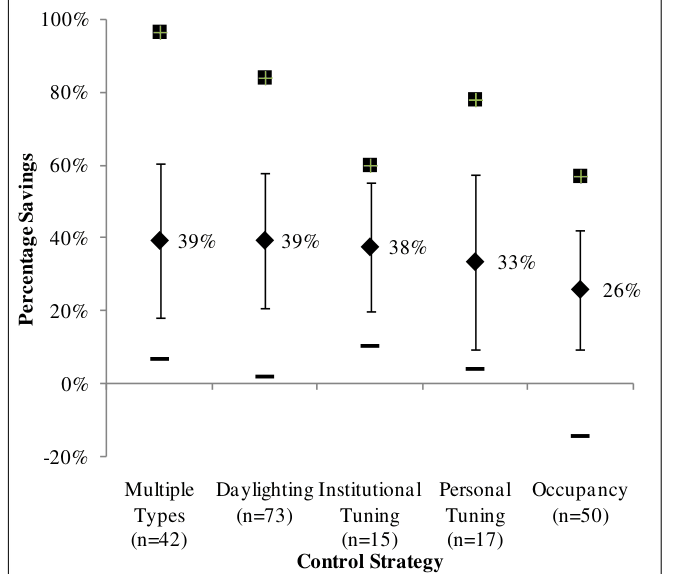
The savings from the second filter are shown in Figure 3. Savings for individual control types range from 26% for occupancy to 39% for daylighting, again representing only a small correction. This filter removes major outliers for occupancy as some estimates had been expressed in percent of wasted light hours.
Savings for actual installations only. For the final filter, we wanted to address savings by how they were calculated – monitoring both the baseline and test case, monitoring the test case and backing out the baseline, calculating a theoretical test case from a monitored baseline, or completely simulating a test case and baseline. To simplify the analysis and prevent reduction to small sample sizes, we looked at differences between savings from actual controls installations and from theoretical installations (simulations or calculations), as these latter studies may be reporting what are essentially maximum potential savings.1 For daylighting, savings from actual installations appear to be significantly lower than those from simulations (28% vs. 48%; p<0.0001). We did not identify significant differences for the other categories,2 likely because of small sample sizes, as the actual differences appeared large for some categories.
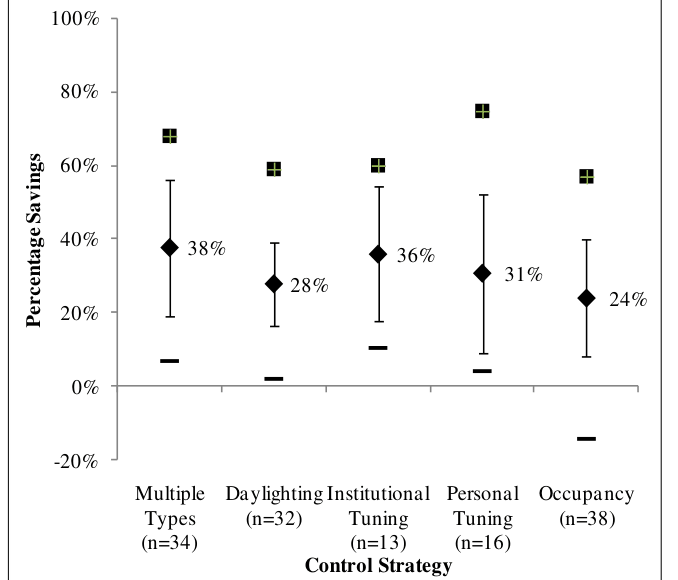
Because of the significant difference for daylighting and the strong possibility that simulated studies over-represent savings, we filtered on this variable. Figure 4 shows the average savings and other statistics following this final filter. Savings for individual control types range from 24% for occupancy to 36% for institutional tuning. Most notably, this filter clearly reduced the savings for daylighting, down to 28%. Although some high values remain, because they come from actual installations, we believe that they represent real savings potential and that this final filter represents the best conservative estimate of controls energy savings achievable in the field.
National Energy Savings Potential
Lighting Control Penetration
To estimate national energy savings potential from lighting controls, we need to know the current saturation of controls, as well as to estimate what “full” saturation would be. Few publically-available studies analyze the penetration or saturation of lighting controls in commercial buildings.3 Those that characterize this information do so in many different ways: by building, by lamp count, by lamp wattage, and within each of those classifications they use either exclusive categories (adding to 100%) or multiple categories (summing to over 100%). Other surveys note what percent of lighting managers use each type of control but do not include an assessment of how widely they apply such controls. In addition, with the exception of the Department of Energy’s Commercial Buildings Energy Consumption Survey (CBECS) - which covers only two types of lighting controls - none of the studies are national in scope. Thus, it is difficult to assess current penetration of lighting controls.
For the current saturation in this analysis, we chose to use the saturation numbers presented by Navigant Consulting, Inc. (NCI 2012) because the same report provides a recent estimate of lighting energy use in commercial buildings. Their study specifies the controls assumptions covered by the energy use estimate, enabling the reader to back out a base case without controls. In addition, it attempts to account for the entire country. The saturations of lighting controls by lamp count from the Navigant report are shown in Table 2. We suspect these numbers may be high,4 but the result is a conservative estimate of national energy savings potential from “full” saturation. Table 2 also contains the control strategies to which we assigned each control type.
| Control Type | Current Saturation (NCI 2012) | Control Strategy Classification |
|---|---|---|
| None | 70% | N/A |
| Dimmer | 3% | 50% personal tuning; 50% institutional tuning |
| Light Sensor | 0.5% | Daylighting |
| Motion Detector | 5% | Occupancy |
| Timer | 4% | Occupancy |
| EMS | 18% | Divided into daylighting and occupancy based on ratio of saturation of those control types alone. Some EMS may be used for task tuning (i.e. institutional tuning) but no mention of this was included in the Navigant report. |
| Total | 100% | N/A |
We based “full” saturation on the theoretical instant application of the code requirements in ASHRAE Standard 90.1-2010, Energy Standard for Buildings Except Low-Rise Residential Buildings, the most recent national model building code, to the existing commercial building stock. This approach ensures that controls are only considered for applications and building spaces considered suitable. Admittedly, the approach also introduces many sources of uncertainty that are not rigorously quantifiable, but probably good to better than a factor of two.
The primary driver for lighting controls in ASHRAE 90.1-2010 is section 9.4.1.1, which requires automatic lighting shutoff in all spaces except where lighting is required for 24-hour operation, where patient care is rendered, and where an automatic shutoff would endanger the safety or security of the room or building occupants. We did not attempt to estimate the floor space required for 24 hour operation or that would endanger safety/security because we believe our energy savings estimates may already account for these exceptions. In other words, while some savings were specifically for a single office that was completely controlled, others were for a whole floor or building that presumably could have contained some of these exception areas. To estimate the percent of commercial building floor space used for patient care, we used CBECS 2003 (DOE n.d.) and NREL Building Prototypes (Deru et al 2011). Overall, we found that 9.4.1.1 requires an occupancy strategy (automatic lighting shutoff) in 99% of commercial floor space. We assumed the remaining 1% of floor space (patient care areas) has no control strategies. Any additional control strategies would move floor space out of the occupancy category and into the multiple approach category.
Section 9.4.1.4 and 9.4.1.5 require daylighting controls in primary sidelighted and toplighted areas. Approximately 15–20% of the existing commercial building stock is estimated to be effectively sidelit, while 2–5% could be effectively toplit (PG&E 2000). As those two categories could overlap, we assumed that 17% of floor space would have daylighting controls in addition to automatic shutoff controls, so would fall in the multiple approach category. The definitions used to arrive at the estimates of effectively daylit areas likely are not equivalent to the requirements and definitions in ASHRAE 90.1-2010, but should provide a useful approximation. Note that this saturation for daylighting controls could be significantly lower than the potential for future saturation if new buildings are designed with better access to daylight.
Section 9.4.1.2 requires that lights in each enclosed space have multi-level manual or automatic controls.5 Some of these spaces must have automatic occupancy-based controls (such as classrooms, offices up to 250 square feet, conference rooms, break rooms, and restrooms), while the remainder can choose. Those spaces that use automatic controls would remain in the occupancy strategy. Those spaces that use manual controls would move into the multiple approach strategy as they would have personal or institutional tuning in addition to an occupancy strategy. However, many of those spaces required to have automatic controls are also the ones most suited to having personal tuning (i.e., private offices). In addition, we assume that for many spaces that would benefit from controls provided for groups of occupants (institutional tuning), such as open offices and retail areas,6 builders will choose automatic controls. A California study shows that in open offices, occupancy sensors are cost-effective, even for one workstation per control group (CUSCST 2011). For small retail at least, we assume that because they are required to have automatic lighting shutoff, they will also choose to have automatic space control. Other areas besides office and retail may choose manual controls, but we are unable to estimate that floor space at this time, and we do not believe those space types would be well-represented by our average energy savings numbers. In addition, because our multiple approach category does not distinguish between the number of approaches, space that already has automatic shutoff controls and daylighting controls would not change category based on the additional presence of personal or institutional tuning, which we believe may overlap with the daylighting areas. Because of these uncertainties, we have decided not to account for any floor space from section 9.4.1.2. We did, however, maintain the percentages in institutional tuning and personal tuning from the current saturation, which moves that floor space from occupancy into multiple approaches, resulting in 20% of floor space in the multiple approach category.
Table 3 shows the current saturation, the saturation based on implementation of ASHRAE 90.1-2010, and the energy savings that will be applied to each strategy. It should be noted that the current saturation is based on lamp count while the “full” saturation is based on floor space, and we are making an assumption for simplification that these are directly comparable.
| Current Saturation (Adapted from NCI 2012) | Saturation based on Implementation of ASHRAE 90.1-2010 | Energy Savings Applied (from Figure 5) | |
|---|---|---|---|
| None | 70% | 1% | N/A |
| Occupancy | 26% | 79% | 24% |
| Daylighting | 1.4% | - | 28% |
| Personal Tuning | 1.6% | - | 31% |
| Institutional Tuning | 1.6% | - | 36% |
| Multiple Approaches | - | 20% | 38% |
| Total | 100% | 100% | N/A |
Calculations
We began with Navigant’s estimate of annual (2010) commercial building interior lighting energy use: 349 Twh (NCI 2012). Navigant notes that its estimate accounts for the effect of controls on operating hours, which would have been accounted for in building manager surveys and metering efforts. However, the estimate does not include the impact of dimming controls, as it is based on average lamp wattage. Therefore we first adjusted annual energy use to account for dimming controls by apportioning the total number of lamps reported by Navigant to each control strategy based on Navigant’s saturation of lighting controls by lamp count, and then adjusting the average energy use of lamps with dimming controls downward by our estimates of energy savings. The adjustment to account for dimming controls resulted in a revised annual energy use of 344 Twh.
We also used Navigant’s original data to estimate a base case energy usage that does not include any controls. For the lamps with on/off controls, we adjusted average energy use upward by the inverse of our energy savings estimates by control strategy. This results in a base case energy usage of 377 Twh, which represents energy use that would occur if there were no controls in place. Based on this information, the current penetration of controls is a savings of 9% over a case in which there are no controls.
We then estimated a “full” saturation energy usage by apportioning the total number of lamps into each control type according to our estimates of “full” saturation, and adjusting the average energy use for lamps in each control type downward by our energy savings numbers. This resulted in energy use of 277 Twh, or a 19% savings over the current energy use with current controls penetration and 27% over energy use that would occur with no controls. Table 4 summarizes the scenarios discussed here.
| Energy Use (TWh) | Savings from Base Case | Savings from Current Case | |
|---|---|---|---|
| Estimated Base Case (No Controls) | 377 | N/A | N/A |
| Estimated Current Case (adjusted NCI value to account for all controls) | 344 | 9% | N/A |
| ASHRAE 90.1-2010 Implementation | 277 | 27% | 19% |
Discussion and Conclusions
This paper examined the entire body of evidence that we could locate on the energy impacts of lighting system controls used in commercial buildings. To arrive at the best estimates of the impacts of different controls, we applied a series of filters to screen out data with significantly different characteristics and to remove possible sources of bias. The first two filters screened out data that include savings from non-controls lighting technology and papers that report savings in something not equivalent to lighting energy. These filters did not create a large impact on overall savings. The biggest single effect from filtering was from the final filter, which screened out data points that were not based on actual installations. We found that simulations appear to overestimate savings achievable in the field, especially for daylighting.
This meta-analysis shows that individual control strategies save on average between one-quarter and one-third of lighting energy, and multiple controls strategies can capture up to nearly 40% savings on average. When applied to current energy use (accounting for existing lighting controls penetration), these figures indicate that a full implementation of lighting controls on a national basis could save up to about 19% of annual lighting energy, or 67 Twh/year (technical potential). The cost effectiveness of such an investment is beyond the scope of this paper.
As we mentioned previously, we believe the estimation of current saturation of lighting controls may be high, which would result in a conservative estimate of energy savings. However, we note again that our estimate of full saturation is subject to non-quantified uncertainties in either direction. As a result, these national energy savings should be considered a rough estimate and are provided to give an idea of the scale of savings possible with the existing building stock and existing controls technologies, irrespective of cost. Advances in building design may allow a broader installation of controls, especially for daylighting, and advances in controls themselves may result in even higher energy savings potential.
Acknowledgements
The authors would like to thank Andy Sturges, Lawrence Berkeley National Laboratory, for his assistance with the development of the full saturation numbers. The work described in this article was funded by the U.S. Department of Energy’s Office of Energy Efficiency and Renewable Energy, Building Technologies Program under Contract No. DE-AC02-05CH11231.
Footnotes
- Because of the simplification, the actual installation category does include two data points based completely on simulation without any monitoring.
- p values were greater than 0.1.
- In general, penetration is the percentage of buildings that have a certain type of control, while saturation is the percentage of lamps, wattage, or floorspace controlled by a certain type of lighting control.
- A California study of commercial buildings in 2001/2002 shows that 80% of lamps are not controlled with something other than a manual on/off switch. (Itron, Inc. 2006) However, a Northwest study showed the percentage of lighting wattage controlled manually decreased from 92% in 2003 to 79% in 2008, indicating a trend to increased lighting controls. (The Cadmus Group, 2009) However, that report shows controls saturation adding up to over 100%, so it is not apparent whether wattage controlled manually is sometimes also controlled by automatic controls, or whether the tendency is for multiple types of automatic controls. Another study found that for some types of lighting, such as linear fluorescent (comprising 88% of interior lighting in that study), a smaller percentage is controlled by manual switches (45%). (The Cadmus Group, 2011)
- Certain spaces are excepted from having multi-level controls including restrooms, corridors, stairways, storage rooms, lobbies, and electrical/mechanical rooms, as well as spaces with low LPD or only one low wattage luminaire.
- These are the building types for which we have data on energy savings from institutional tuning in the form of controls provided for groups of occupants.
References
- [ASHRAE] American Society of Heating, Refrigerating and Air-Conditioning Engineers, Inc. 2010. ANSI/ASHRAE/IES Standard 90.1-2010 Energy Standard for Buildings Except Low-Rise Residential Buildings. I-P Edition.
- [CUSCST] California Utilities Statewide Codes and Standards Team. 2011. Draft Measure Information Template – Indoor Lighting Controls. Pacific Gas and Electric Company, Southern California Edison, Sempra Utilities.
- Desroches, L-B. & Garbesi, K. 2011. Max Tech and Beyond: Maximizing Appliance and Equipment Efficiency by Design. Berkeley, Calif.: Lawrence Berkeley National Laboratory.
- Deru, M., K. Field, D. Studer, K. Benne, B. Griffith, P. Torcellini, B. Liu, M. Halverson, D. Winiarski, M. Rosenberg, M. Yazdanian, J. Huang & D. Crawley. 2011. U.S. Department of Energy Commercial Reference Building Models of the National Building Stock. NREL/TP-5500-46861. Department of Energy. Golden, CO: National Renewable Energy Laboratory.
- Guo, X., D.K. Tiller, G.P. Henze & C.E. Waters. 2010. “The Performance of Occupancy-Based Lighting Control Systems: A Review.” Lighting Residential Technology 42:415-431.
- Itron, Inc. 2006. California Commercial End-Use Survey. California Energy Commission. [Processed data from energyiq.lbl.gov]
- [LRC] Lighting Research Center. 2003. Reducing Barriers to Use Of High Efficiency Lighting Systems Final Report Year 2: March 2002- January 2003. US Department of Energy.
- [NCI] Navigant Consulting, Inc. 2012. 2010 U.S. Lighting Market Characterization. U.S. Department of Energy.
- [NBI] New Buildings Institute. 2011. “Advanced Lighting Guidelines.” <http://algonline.org/index.php>.
- [PG&E] Pacific Gas and Electric. 2000. AB 970 Nonresidential Standards Proposals – Codes and Standards Enhancement (CASE) Study: Lighting Controls, Draft.
- [SCE] Southern California Edison. 2008. Office of the Future Phase II report: The 25% Solution. ET 08.01. The Office of the Future Consortium.
- The Cadmus Group, Inc. 2009. Northwest Commercial Building Stock Assessment Final Report. Northwest Energy Efficiency Alliance.
- The Cadmus Group, Inc. 2011. Michigan Baseline Study 2011: Commercial Baseline Report. Michigan Public Service Commission.
- [DOE] U.S. Department of Energy. n.d. “2003 CBECS Detailed Tables.” <http://www.eia.gov/emeu/cbecs/cbecs2003/detailed_tables_2003/detailed_tables_2003.html#enduse03>.
- [DOE] U.S. Department of Energy. 2011. “Energy efficiency program: test procedure for lighting systems (luminaires).” Federal Register 76(150):47178-47180.
For a full list of references including all 88 papers and case studies used in the analysis, see:
Williams, A., B. Atkinson, K. Garbesi, E. Page & F. Rubinstein. 2011. A Meta-Analysis of Energy Savings from Lighting Controls in Commercial Buildings. LBNL-5095E. Berkeley, Calif.: Lawrence Berkeley National Laboratory. <http://efficiency.lbl.gov/drupal.files/ees/Lighting%20Controls%20in%20Commercial%20Buildings_LBNL-5095-E.pdf>
This document is a work of the U.S. government or a government-funded laboratory and is reproduced in full for research and educational purposes. Logistics Lighting has re-formatted it for readability; the wording is the original author's. Report an error at info@logisticslighting.com.
← Back to the Daylighting Library