
ORNL's three-year (2006–2008) monitored evaluation of Wal-Mart's experimental McKinney, Texas supercenter versus a reference store: daylighting saved about 150,000 kWh/yr, LED case lighting 15–20%, PV arrays hit 87% of expectations, and HVAC retrofits cut over 400,000 kWh/yr.
Public-domain work of Oak Ridge National Laboratory (U.S. Department of Energy, managed by UT-Battelle, LLC), prepared for Wal-Mart Stores, Inc. and reproduced in full. Original report: Technical Evaluation of the McKinney, Texas Experimental Store, December 9, 2009 Final Report, ERD-04-2474 (no publisher web page for this report was located).
Technical Evaluation of the McKinney, Texas Experimental Store
December 9, 2009 Final Report — ERD-04-2474
Michael MacDonald
Tarrah Glass
Prepared by OAK RIDGE NATIONAL LABORATORY, Oak Ridge, Tennessee 37831-6070, managed by UT-BATTELLE, LLC, for WAL-MART Stores, Inc., Bentonville, AR 72716-0550. Contact: James McClendon. Under Contract No. ERD-04-2474.
Disclaimer
This report was prepared as an account of work by an agency of the United States Government. Neither the United States government nor any agency thereof, nor any of their employees, makes any warranty, express or implied, or assumes any legal liability or responsibility for the accuracy, completeness, or usefulness of any information, apparatus, product, or process disclosed, or represents that its use would not infringe privately owned rights. Reference herein to any specific commercial product, process, or service by trade name, trademark, manufacturer, or otherwise, does not necessarily constitute or imply its endorsement, recommendation, or favoring by the United States Government or any agency thereof. The views and opinions of authors expressed herein do not necessarily state or reflect those of the United States Government or any agency thereof.
Foreword
As part of a commitment to environmental responsibility and leadership in building and operating retail facilities that minimize the use of energy and natural resources, in 2003, Wal-Mart embarked on a research and information-gathering process to learn what advanced building technologies, products, and information were available. The process started with a tour of advanced commercial buildings throughout the United States, United Kingdom, and Germany to see what best available technologies were being used successfully in buildings of comparable size and scope. In addition, a number of conferences and meetings were attended to find out more about renewable energy technologies, green building technologies, and innovative products like LED lighting.
The company wished to learn more about how they and the entire industry can improve efficiencies and reduce environmental impacts, so the company decided to construct and operate two experimental stores in two different locations in the United States. In June 2003 Wal-Mart chose McKinney, Texas, and Aurora, Colorado, as the sites for their experimental stores.
This report presents results from multiple experimental efforts in the McKinney store, primarily related to energy impacts of different technologies. Oak Ridge National Laboratory (ORNL) was selected as the third-party evaluator to conduct the technical evaluation of advanced renewable power generation and resource conserving technologies applied to an experimentally focused Wal-Mart supercenter in McKinney, TX. Technologies specified for evaluation in the original Scope of Work are denoted in the text. Some additional technologies were also tracked as part of the work. The results of three years of detailed energy monitoring are presented and summarized in the report.
In addition to this report, monthly reports on all the experimental monitoring results were delivered to a team of participants designated by Wal-Mart. These monthly reports were beyond the original scope of work defined for the project, but they replaced individual reports on specific technologies that were defined in the scope of work. This report finalizes the three-year monitoring effort of 2006–2008 with results or information on all the deliverables for this work.
In addition, Wal-Mart installed several retrofits in the McKinney experimental store in 2009, and some initial limited results are presented on energy impacts of those retrofits for the periods in 2009 for which data are available.
Energy Key Points
Some key points on energy use and efficiency are presented briefly here. Wal-Mart has continued to develop new “experimental” stores (called HE for high-efficiency) beyond what was done in the McKinney and Aurora, CO stores. McKinney and Aurora provided some major new experience with hydronic-based energy systems. Important lessons from McKinney included the need for better integration of the hydronic approaches and better matching of systems to climate. McKinney results highlighted the need for better control of water-cooled refrigeration systems, and the HE efforts have continued to refine the overall refrigeration system control and overall hydronic system integration.
Potential energy savings for existing buildings and facilities in the U.S. commercial sector for “retro-commissioning” (making energy systems work better and more efficiently) have been estimated at 500–700 Trillion Btu of primary or source energy (average of 10–15% savings of total energy use in a building), which primarily come from controls fixes and changes for heating/cooling (HVAC) and lighting systems. Observations of controls issues at the McKinney stores suggest Wal-Mart may have potential for similar savings levels in their facilities.
Use of daylighting at the McKinney stores reduces lighting energy use about 150,000 kWh/yr over what the use would be without daylighting. Daylighting continues to be important in new stores. Use of LED (light-emitting-diode) lighting was a major part of the experimental stores, and Wal-Mart continues to deploy LED lighting and study new LED lighting applications. Efficiency and usability of LED lighting continues to advance at a rapid pace. LED refrigeration case lighting in McKinney was indicated to save 15–20% relative to the reference store (35,000–50,000 kWh/yr). Other refrigeration case improvements (expanded use of doors on medium-temperature cases, improved heat exchange, improved motors) were measured to provide 80,000 kWh/yr savings (about 25%).
The HVAC electricity savings from changes made in 2008 and the HVAC retrofits in 2009 at the experimental store are indicated to be about 180,000 kWh/yr compared to the 2006 / 2007 HVAC electricity use. The renewable-energy on-site systems results indicate that extra attention must be directed toward inverter selection, design, and operational settings. The solar cell (photovoltaic) systems generated about 87% of expectations. The large wind turbine had extended inverter problems and only generated 37% of expectations.
The use of fabric duct systems leads to excessive fan energy use to keep the fabric inflated, when compared to the standard store air delivery systems, and since the hoped-for air temperature stratification was not maintained over full 24-hr periods, the use of fabric ducts appears to be of questionable value. However, the standard approach of supply and return plenums at the roof level also appears to potentially lead to localized air circulation issues, such as at the Pharmacy in the reference store.
Measurement of carbon dioxide levels is standard for supercenters, and the carbon dioxide data for the McKinney stores indicate supercenters are very well ventilated most hours in a year and could be called “over-ventilated” at night. Decisions about how much to ventilate and potential impacts on customer perceptions of well-being while in a store are complicated, but further study of carbon dioxide levels in all properties and potential means of reducing energy impacts of potential “over-ventilation” may be worth pursuing. This type of change would best be integrated into an overall retro-commissioning approach, and data from McKinney suggest average retro-commissioning savings could be increased from the 10–15% range up to the 15–20% range of total store energy use, if reductions in over-ventilation can be accomplished effectively.
Results for other experiments are covered in the report.
Introduction
This document provides the technical evaluation reports developed for the Wal-Mart “experimental” supercenter in McKinney, Texas, for the experimental period from January 2006 through December 2008 (three years). A second experimental supercenter with both similar and different experimental features was constructed in the same time frame and operates in Aurora, Colorado. These stores are part of ongoing efforts at Wal-Mart to increase the examination and study of sustainable technologies, practices, and processes for new facilities.
Basic Project Information
| Item | Detail |
|---|---|
| Project | Experimental SuperCenter 1 |
| Location | McKinney, TX |
| Owner | Wal-Mart Stores, Inc. |
| Wal-Mart Project Lead | Don Moseley |
| Design / Builder | Turner Construction Company |
| Design Team | Architect: LPA, Inc. Mechanical Engineer: Ove Arup and Partners California, Ltd. Electrical Engineer: Ove Arup and Partners California, Ltd. Lighting Engineer: Ove Arup and Partners California, Ltd. Structural Engineer: Wallace Engineering, Inc. Civil Engineer / Landscape Architecture Consultant: Kimley-Horn and Associates, Inc. Landscape Architect: John Murphy Natural Resources Consultant: Steve Clark & Associates, Inc. (SCA) Solar Consultant: Solar Design Associates Green Features Consultant: the GreenTeam, Inc. |
| Commissioning Agent | Architectural Energy Corporation |
| Grand Opening | July 20, 2005 |
The McKinney Experimental supercenter was evaluated by ORNL and others for three years to investigate materials, technology, and processes which:
- Reduce the amounts of energy and natural resources required to operate and maintain the stores.
- Reduce the amount of raw materials needed to construct the facility.
- Substitute, when appropriate, the amount of renewable materials used to construct and maintain the facility.
Experiences with the Experimental supercenters that demonstrate verified desired performance have been or will be applied to other Wal-Mart facilities. The performance of some experiments at the experimental McKinney site are compared to another (baseline) supercenter in McKinney that does not have the experimental features. The baseline supercenter served as the store representative of the then current version of supercenters being built around the world.
The store site is in McKinney, Texas, about 30 miles north and slightly east of Dallas, near the junction of US Highway 75 and State Highway 380. The total site covers about 24 acres.
Many energy and environmental features were considered and analyzed for inclusion in the test store, including extensive landscaping, wetland additions, materials reduction and substitutions, wind and photovoltaic energy systems, lighting systems, heating and cooling systems, and grocery systems. Final selection was made by Wal-Mart staff, based on input from the design team.
ORNL Scope
Oak Ridge National Laboratory (ORNL) efforts related to the McKinney experiments involved third-party (not involved in the design or feature selection) evaluation of the energy saving, and some of the environment-enhancing, concepts being tested. Whole store performance for the experimental store was to be evaluated and compared to that of the baseline store as well. The reports on the different aspects of the evaluation are covered in this document. Deliverables from the Scope of Work are designated ‘Dx’ or ‘Dx.x,’ where ‘x’ or ‘x.x’ is the deliverable number.
Wal-Mart has installed retrofits to the experimental store in 2009, based on agreement with the store manager and desired improvements in energy efficiency. Information on these retrofits and some very limited information on energy impacts or potential impacts are covered in the Evaluation of Individual Measures section in this report.
Background
Some of the experiments involve new systems that have no counterpart in typical Wal-Mart stores, and these are being tested to evaluate their individual performance. Other experiments are a modification to typical store systems, so in such cases performance is compared to the baseline store. An “official” list of experiments is shown below. The parties responsible for providing experimental performance results are indicated in the “Who” column. Later experience caused some of these “experiments” to be combined, since they overlapped.
| # | Name | Who |
|---|---|---|
| 1 | Exterior Lighting | ORNL |
| 2 | Captured Refrigeration Waste Heat | ORNL |
| 3 | Recovered Bio-Fuel | ORNL |
| 4 | PV5 Photovoltaic (PV) Roof-Mounted Polycrystalline | ORNL |
| 5 | PV3 Roof-Mounted Amorphous | ORNL |
| 6 | PV6 Clerestory, integral with PV5, so no separate measurement | ORNL |
| 7 | PV1 & 2 Flat-Roof Mounted Thin Film | ORNL |
| 7a | PV4, Building Integrated Photovoltaic: Garden Center Roof-Mounted, Clerestory Amorphous | ORNL |
| 8 | Fly Ash in Building Concrete | Wal-Mart |
| 9 | Reduced Volatile Organic Compounds | Wal-Mart |
| 10 | Reduced Building Height | Wal-Mart |
| 11 | Reduced Tenant Space Height | Wal-Mart |
| 12 | Construction Waste Recycling | Turner |
| 13 | Natural Lights and Controls | ORNL |
| 14 | Reflective Coating on the Building | ORNL |
| 15 | Alternative Freezer and Cooler Units | ORNL |
| 16 | Radiant Floor Heating | ORNL |
| 17 | Air Distribution System | ORNL |
| 18 | Passive Cooling at the Garden Center | ORNL |
| 19 | Burning Used Motor Oil | ORNL |
| 20 | Main Store Area Lighting | ORNL |
| 21 | Reduced Nighttime Lighting Levels | ORNL |
| 22 | Recycled Food Waste | Wal-Mart |
| 23 | LED Lights in Grocery Cases | ORNL |
| 24 | Light-Powered Infrared Sinks | ORNL |
| 25 | Air Conditioning Condensate Water Recovery | ORNL |
| 26 | Waterless Urinals | Wal-Mart |
| 27 | Experimental Urban Forest | SCA |
| 28 | Wildflower Meadow | Discontinued |
| 29 | Wind Turbine | ORNL |
| 30 | Heat Island Effect | Not evaluated |
| 31 | Pervious Pavement | Wal-Mart |
| 32 | Water Conservation (including roof runoff capture) | ORNL |
| 33 | Xeriscape | SCA |
| 34 | Bioswale | SCA |
| 35 | Vestibule Thermal Performance | ORNL |
| 36 | CO Demand-Controlled Ventilation 2 | ORNL |
| 37 | Heating and Cooling Performance | ORNL |
| 38 | Water-Cooled Refrigeration | ORNL |
| 39 | Building Illuminated Signs | Wal-Mart |
| 40 | Monument Signs | ORNL |
| 41 | Hybrid Solar Lighting | ORNL |
The experimental testing and monitoring period covered the years 2006 – 2008. Following the end of the testing, Wal-Mart made some changes to the store to help bring it as much as possible out of the experimental mode, in order to operate as a normal supercenter. These changes, or retrofits, together with some information on impacts, will also be described in the report.
History
Wal-Mart Stores has examined “green” or sustainable features in their facilities for many years, and has incorporated many of the good performers into standard designs now. Three stores provided an initial examination of energy and environmental sustainability features. Each of these demonstration stores has solar lighting, special plumbing systems to reduce water use, and many other energy-saving features.
Demonstration Store 1
In 1993, Wal-Mart opened its first Demonstration Store in Lawrence, Kansas. Focusing on the use of environmental and experimental building materials, wood was chosen as the largest material source for the structure, since it can be reused or recycled. The store also features many energy-saving features, including a recycled asphalt parking lot.
Demonstration Store 2
This supercenter in Moore, Oklahoma, focuses on showcasing energy-saving processes. The "centerpiece" of the store is a futuristic Heating, Ventilation and Air Condition (HVAC) system that coordinates space conditioning and dehumidification, ventilation, indoor air quality, heat recovery and refrigeration with reduced energy use.
Demonstration Store 3
This Wal-Mart in City of Industry, California, incorporates all of the best features of the two previous demonstration stores and features three electric car-charging stations. In addition, this store also has 180 high-performance skylights on the roof of the building to allow natural light from the sun into the store. Light sensors continuously measure the amount of daylight entering the building and adjust the light fixtures so that only the necessary amount of electrical light is used.
Comparison with US Energy Data
The operation of all commercial buildings accounts for approximately 18% of the total primary energy consumption in the United States. The total for all buildings is more than one-third of the primary energy consumption and more than 70% of the electricity consumption. The operation of buildings in the United States results in 38% of U.S. and 9% of global carbon dioxide (CO2) emissions.
A supercenter offers an interesting application of the latest energy use index data in the 2007 ASHRAE Handbook—HVAC Applications, Chapter 35 on energy use and management, Table 2. The table provides weighted energy use indices (EUIs), kBtu/ft2 per year of site energy (no electric or other losses included), for key distributional percentiles, and the mean for about 50 building types in the U.S. Department of Energy’s Commercial Buildings Energy Consumption Survey (CBECS) microdata for 2003 (www.eia.doe.gov/emeu/cbecs).
The space uses in a typical supercenter are close to those shown in Table 1, although additional refinement is possible. The space percentage breakouts can be applied to the mean EUIs for each space type corresponding to a building type from the Handbook. A comparison can be calculated for “mean” or “average” building energy use for a supercenter, based on average EUI data for the United States for similar space types. The average comparable type of space mix in the United States calculates to a total EUI of 148 kBtu/ft2 per year. Comparison with medians, or the 50th percentile data, is considered important, since the average values often are skewed by very high energy users at the top end of each distribution. A similar calculation with medians leads to a calculated median total EUI of 115 kBtu/ft2.
| Space Type | Percent of total floor area | 2007 Handbook mean EUI, kBtu/sq-ft | EUI Allocation, kBtu/sq-ft per yr |
|---|---|---|---|
| Grocery | 30% | 213 | 64 |
| Restaurant | 1% | 302 | 3 |
| Other retail | 50% | 120 | 60 |
| Non-refrigerated warehouse | 8% | 34 | 3 |
| Other service | 11% | 168 | 18 |
| TOTAL | 100% | 148 |
Data from energy measurement efforts in 2001–2002, combined with energy measurement data from the experimental monitoring, shows the energy use for a typical Wal-Mart supercenter of 206,000 ft2 (19,000 m2). The notion of “typical” becomes complicated when a variety of climates exists, which is the case for supercenters. The typical supercenter was evaluated as having gas-fired dehumidification media regeneration in the 100% outdoor air units, so gas use occurs year-round for heating and dehumidification in the data shown here.
The typical electric use is calculated to be 5.8 GWh/yr, and the typical natural gas use is calculated to be 1.7 GWh/yr, for an EUI of 123 kBtu/ft2 (1397 MJ/m2) per year, or 17% less than the average comparable CBECS EUI calculated in Table 1, and 7% more than the median, which is respectable for 24/7 operation. Figure 1 shows the monthly profile of electricity use, and Figure 2 shows the profile of gas use. Keep in mind that supercenters operate 24/7 and generate a fair amount of heat internally.
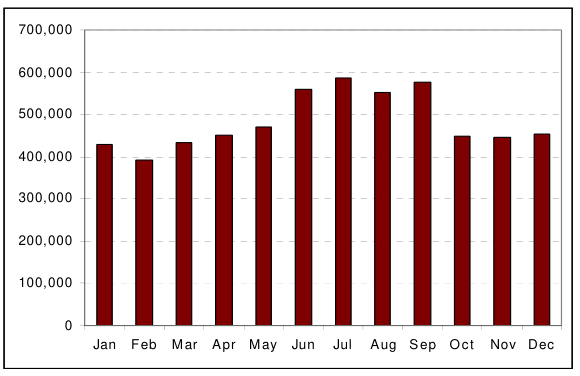
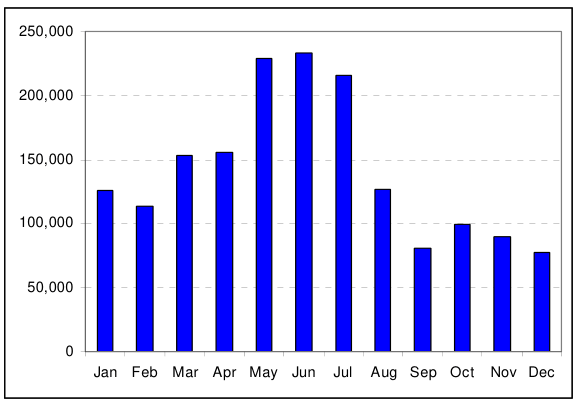
A breakout of fuel use by end use also was developed. Gas use is calculated to be 15% for cooking (including a food service tenant), 36% for gas dehumidification and 49% for heating. The breakout of electric use is shown in Table 2. Refrigeration and lighting are the larger end uses, but plug loads are significant and appear to be growing over time. HVAC fan and cooling energy are controlled reasonably well.
| Electric End-Use | % |
|---|---|
| Lighting | 28% |
| Plug loads | 22% |
| Refrigeration | 31% |
| HVAC fans and cooling | 19% |
| TOTAL | 100% |
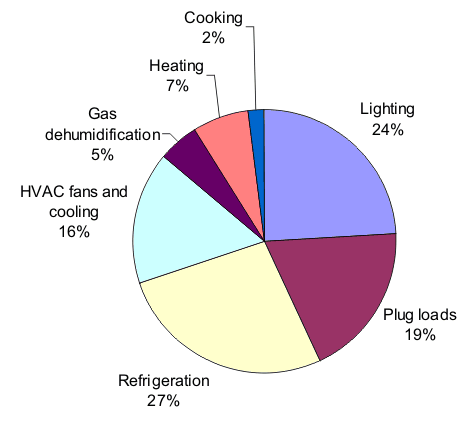
An estimated cost percentage breakout is shown in Figure 3 for the total energy costs for electricity plus natural gas. The cost breakout is based on the electric and gas profiles shown in Figures 1 and 2, as well as the end-use breakouts.
Preliminary Work
Prior to completion of construction of the experimental store in McKinney, efforts were required in several areas to conduct the evaluation and support the overall project. First ORNL had to establish evaluation management interfaces with several Wal-Mart contractors and with Wal-Mart staff to keep planning and implementation activities progressing acceptably (D0). Second, instrumentation and data acquisition system (DAS) specifications and documentation had to be developed and transmitted to contractors as needed (D1). Third, oversight of the activities led to successful installation of the evaluation equipment and materials needed (D1.2).
Design Intent Report
A report on store design and commissioning was proposed to be delivered under this project, but in meetings with Wal-Mart staff and contractors, a more important need was identified as compilation and editing of a “design intent” report (D1.3). ORNL assumed responsibility for the report on the McKinney store, based on input from the entire design team. The final draft 40-page report was delivered to Wal-Mart and the entire design team in early November 2005, titled Innovative Energy and Environmental Systems Descriptions and Performance Expectations for McKinney Texas.
Experimental Design
As indicated previously, multiple types of experimental designs were used for this evaluation. Side-by-side evaluation of the experimental store performance, as compared to a baseline reference store in McKinney, was used for measures that involved systems that had counterparts in the reference store. Unique systems were subject to a straightforward technology evaluation design approach.
Electrical and mechanical metering plans and layouts were developed for both the experimental store and the baseline reference store. ORNL had the meters and wiring installed in the experimental store using the electrical and mechanical contractors for the store. Wal-Mart had their monitoring company, ICTEnergy, install the meters and wiring in the reference store.
Markups of Drawing E2 showing instrumentation cable layouts are presented in Appendix IC for both the experimental store and the reference store. This appendix also shows tables of the instrumentation devices and locations and how the cabling connects devices.
Annual Status of Monitoring Systems (D1.4)
Status information on the monitoring systems for the experimental store (206) and the baseline reference store (5211) is presented here. The system at the experimental store was installed by ORNL. The reference store was already being monitored by EnergyICT (Energy Information and Communication Technologies) for various energy data, including some information related to state tax issues. ORNL developed the monitoring plan for the reference store (see Appendix IC) and worked with an EnergyICT contractor to upgrade the EnergyICT system at the reference store to include the data needed for the evaluation work.
Experimental Store
The experimental store monitoring system was installed prior to store fit-out in June-July 2005. System testing was conducted through October, and system debugging and sensor corrections were made in November 2005. The external internet connection to the store (not connected to the Wal-Mart network) was established by Fat Spaniel Technologies to power the remote energy results tracking application. Fat Spaniel set up routing port connections on their router for ORNL to use for remote data collection.
Since cable runs from the front to the back of the store were very long, some data logger communication problems surfaced in November 2005. Wal-Mart installed an additional internet cable to the data logger at the front of the store in early 2006, and Fat Spaniel set up an additional router port, which allowed the communications issue to be corrected in January 2006. Data communications after that were very good, except when the router did not function. Some minor router issues in 2006 were corrected by Fat Spaniel, and data communications since then have been flawless.
The ORNL data loggers at the experimental store have 5–6 days of data storage, so short disruptions of communications do not cause any data to be lost.
The electric meter units on the photovoltaic arrays required periodic checks to assure reasonable calibration and to keep wiring connections tight. Some electric meters in EDC 4 (EDC means electric distribution center) were found to have bad connections and insulation, which required correction in 2007.
Despite minor problems all data needed for the evaluation reports were available and delivered results for almost all months in 2006, 2007, and 2008.
Reference Store
The initial upgrade to the EnergyICT system was completed in May 2005 and provided all the electric use data needed. Additional upgrades to also include temperatures, humidities, light intensities, and gas end-uses were completed in October 2005. Corrections to electric metering configurations were completed by early 2006. The data are maintained on the Wal-Mart EnergyICT website for store 5211 (accessed via the internet), so all Wal-Mart staff or contractors with enabled accounts can access these data now. Indoor temperature and humidity data had many problems, but with multiple sensors in each temperature rake (vertical stack), this situation did not diminish the ability to report on temperature comparisons between the stores.
Some other minor data problems were encountered over the course of the evaluation period, but most were corrected within a month or two. Data needed for the monthly evaluation reports were delivered in all months of 2006, 2007, and 2008.
Overall Store Performance Reports (D2.4)
This section covers both the overall performance reports (D2 and D4.1) and some of the environmental impact results (D3) reported. At the beginning of the project monitoring, Wal-Mart changed the direction of the reporting away from quarterly reports, and requested monthly reporting instead. In addition, each monthly report was to include a historical summary of results from the beginning, so the need for annual reporting was made unnecessary.
Another set of circumstances influencing reporting of results relates to the water systems at the site, where leak issues at the storm runoff collection pond at the site made water impacts results not meaningful for much of the reporting period. Thus, environmental impacts reporting became less central to the project, and since other project participants were more directly involved in making measures related to water and land impacts work well, ORNL reporting on water and land environmental impacts did not serve the project processes appropriately and is thus limited in this report. Many of the land impact and water impact measures required continued adjustment and direct intervention after the store grand opening, so reporting under the technical evaluation effort would only be based on marginal information. The main environmental impact results reported are on air emissions, which are important to Wal-Mart international environmental reporting. Air emissions results are reported in this section of the report (D3.1).
ORNL delivered monthly performance reports to Wal-Mart for the months of January 2006 through December 2008. Each month both a summary report and an engineering report were delivered to designated recipients. The summary reports covered the overall store performance results.
First-year Annual Performance Report for 2006 (D2.1/D4.1)
The following graphs and tables provide an overview of the energy performance of the experiments at the McKinney, Texas, experimental (#206) supercenter compared to expected performance and to the performance of the reference store (#5211) in McKinney, Texas. The first full year is 2006, and data are shown for both stores with a percentage comparison. The key difference between the stores to understand is that dehumidification is by gas-fired air-handler units (AHUs) in the reference store and by electric-only AHUs in the experimental store. Both stores heat with natural gas, with a boiler system and hot-water coils in the experimental store and direct-fired furnaces in the rooftop units at the reference store.
Total Energy and Air Emissions 2006
Total energy and emissions for both stores in 2006 are covered in Table 3. The notes below the table describe the quantities listed. Higher electrification in the experimental store led to higher source energy use and higher emissions, since Texas ERCOT electricity has high emissions. The air emissions values are in metric tons of carbon-dioxide-equivalent, where equivalency is based on global warming potential. Carbon dioxide has a reference value of 1 for these calculations, and the other two primary emissions components considered are methane (CH4) and nitrous oxide (N2O). Relative to a pound (or kg) of carbon dioxide, a pound (or kg) of methane contributes 23 times as much to potential global warming, and a pound (or kg) of nitrous oxide contributes 296 times as much. Refrigerant leakage is not included in these calculations, and refrigerant leakage was not part of the scope of the evaluations. The emissions figure shows how the higher use of gas, and air-cooled refrigeration, at the reference store lead to lower total emissions most of the year.
| Energy End Use, kWh except where noted | Experimental Store | Reference Store | Comparison (%) |
|---|---|---|---|
| Total Facility Electricity | 6,419,212 | 5,869,609 | 9% |
| Net Facility (Purchased) Electricity | 6,311,002 | 5,869,609 | 8% |
| Natural Gas for HVAC | 855,637 | 1,504,131 | -43.1% |
| Net Facility site energy | 7,166,639 | 7,373,740 | -3% |
| Net Facility source energy | 24,040,536 | 23,149,640 | 4% |
| Net facility emissions, MT CO2e | 5,810 | 5,404 | 8% |
Table Notes:
- The Total Facility Electricity is all the electricity used in the facility, including renewables.
- HVAC natural gas does not include gas used for the bakery or food service tenant.
- Net Facility site energy is the purchased electricity plus HVAC gas.
- Net Facility Source Energy accounts for all the energy used to extract, transport, generate, and deliver purchased electricity and HVAC gas to the site. The site to source conversion factors are 3.658 for electricity in the Texas ERCOT region and 1.116 for natural gas based on 2000 national data, taken from Source Energy and Emission Factors for Energy Use in Buildings, NREL/TP-550-38617, June 2006, Deru and Torcellini, Tables 3 and 5, http://www.nrel.gov/docs/fy06osti/38617.pdf
MT CO2e Note:
- MT CO2e stands for metric tons of carbon-dioxide-equivalent, where a metric ton is 1,000 kg or 2,205 lb, and equivalent CO2 emissions are for energy only based on the global warming potential of 1 for CO2, 23 for CH4, and 296 for N2O. Refrigerant leakage is not included.
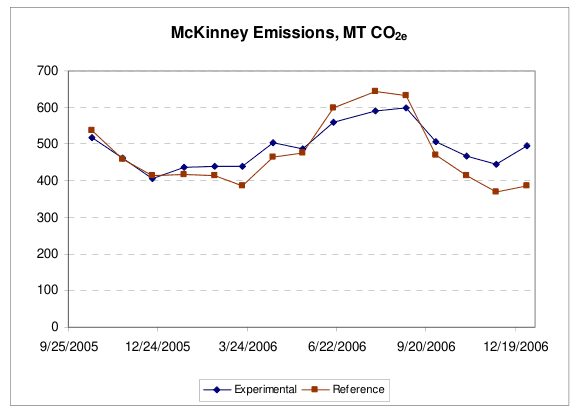
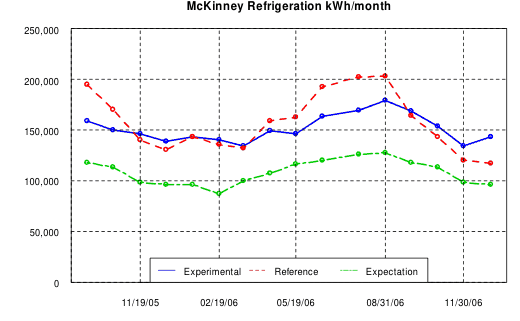
Electricity use in the reference store goes higher than the experimental store in hotter weather because the refrigeration condensers are air-cooled and rooftop units (fans) must run more to keep the store cool. The experimental store has water-cooled refrigeration condensers. The experimental store uses electricity for dehumidification, while the reference store uses gas, so the electricity use for the experimental store is not as much lower as might be expected. The refrigeration system in the experimental store is also using more electricity than expected all year round.
From about December through April (mild to cold weather), electricity use in the reference store is lower because the air-cooled refrigeration uses less electricity, and the rooftop unit fans do not need to run as much to satisfy the small heating load. The experimental store rooftop units must run all the time to keep the ductsox inflated, and variable air volume is not installed, so fan electricity is higher than in the reference store.
HVAC natural gas use in the reference store is driven by both heating and dehumidification needs. In the experimental store, HVAC gas is only used for heating, although control cycles appear to cause some small use of HVAC gas in hot weather. The reference store uses a lot more HVAC gas than the experimental store in hot weather in 2006, but there was a control problem in the dehumidification system control that was corrected by September 2006. Boiler capacity and control issues in the experimental store have caused numerous problems, and extensive testing and some manual control had to be introduced, which caused some increase in gas use. The capacity and control issues cause gas use to be higher than would occur if there were no issues, as the system does not respond well to sudden drops in outdoor temperature.
End-Use Energy Consumption Summary 2006
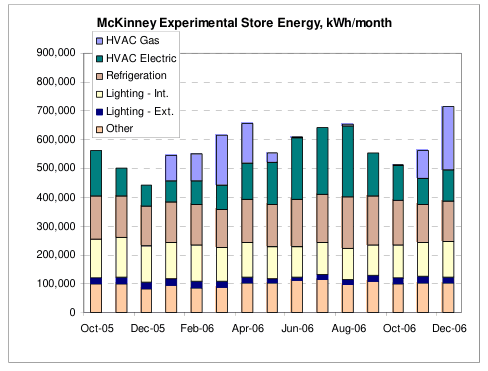
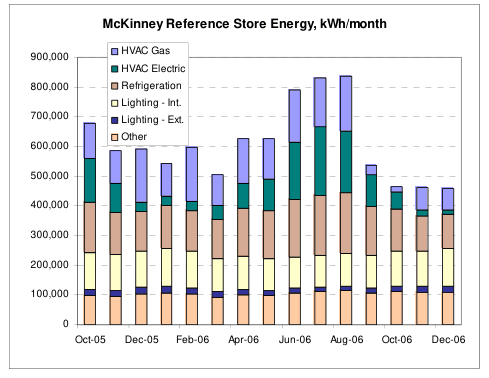
The site energy consumption by end use is shown in Figures 5 and 6 below and is listed in Table 4. The end use data in the figures is shown monthly for October 2005 through December 2006. The major end use categories shown are: HVAC Gas, HVAC Electric, Refrigeration, Lighting – Interior, Lighting – Exterior (parking lots), and Other (which includes tenants’ electricity). Table 4 shows the annual totals for each end use category, and these totals do not include the renewable electricity that was generated at the experimental store (net site energy). Note that site energy is NOT representative of total air emissions.
These figures show the higher gas consumption at the reference store before September 2006, when the controls issue was corrected, and the beginning of increased gas use at the experimental store in December 2006, when solutions were being tested to deal with the boiler control and response issues. The HVAC electric use at the reference store also plummeted, beginning in October 2006 and lasting about a year, due to controls changes there that severely limited AHU runtimes.
| Energy End-Use | Experimental Store (kWh) | Reference Store (kWh) | Comparison (%) |
|---|---|---|---|
| HVAC Gas | 855,637 | 1,504,131 | -43.1% |
| HVAC Electricity | 1,672,559 | 1,126,459 | 48.5% |
| Refrigeration | 1,821,702 | 1,875,525 | -2.9% |
| Interior Lighting | 1,387,274 | 1,372,599 | 1.1% |
| Parking Lot Lighting | 235,163 | 223,168 | 5.4% |
| Other Electrical Loads | 1,205,174 | 1,271,858 | -5.2% |
Notes:
- The data presented here do include renewable electricity generated at the site, but do NOT include energy from waste oil burned, or gas used for the store bakery or food service tenant. Values do include electricity used by the bakery and all tenants.
- The HVAC Gas for the Experimental store includes the natural gas used in the natural gas boiler. The HVAC Gas for the Reference store includes the gas used in the rooftop units, central air handlers, and infrared heaters.
- The HVAC Electricity for the Experimental store includes the electrical energy used in the rooftop units, central air handlers, and pumps (air curtain heaters are not really used in the experimental store, and the reference store has gas infrared heaters). The HVAC Electricity for the Reference store includes the electricity used in the rooftop units, and central air handlers, although the central air handlers essentially did not run this month.
- The Other Electrical Loads includes all electricity use in the building that is not part of the other measurements.
Additional information on end uses is provided next. See the List of Experiments in the Background section at the beginning of this report (pp 2–3) for system references, such as PV arrays.
Refrigeration and HVAC Energy Summaries 2006
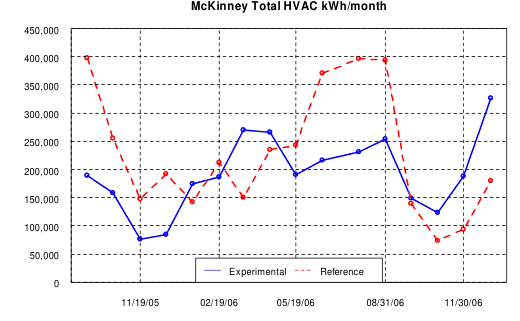
The total HVAC energy, in kWh, is the sum of both electric and gas energy.
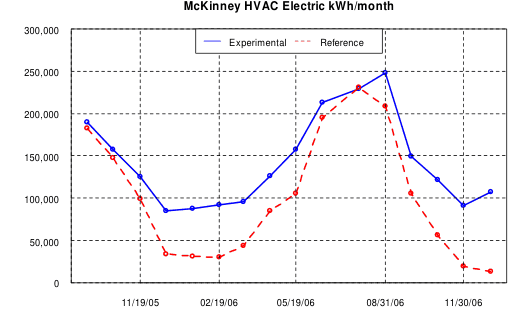
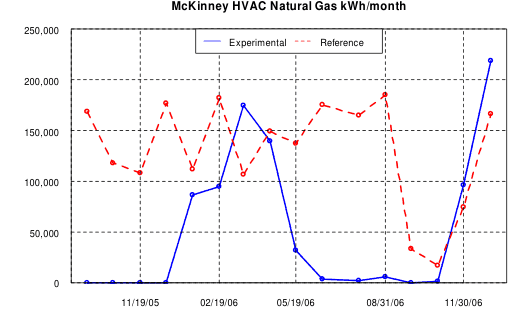
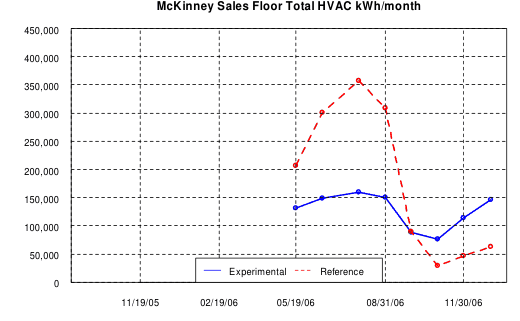
Notes:
- The expectations for refrigeration performance from VaCom, 12-15-06, that better match the actual systems, are in the green curve above.
- HVAC natural gas does not include gas used for the bakery or food service tenant.
- HVAC electricity includes the air handler units and rooftop units, as well as the pumps for the experimental store.
- Sales floor total HVAC energy is gas and electricity used by the AHUs and RTUs serving the main sales floor.
- The reference store uses gas for dehumidification, while the experimental store uses electricity. Both stores use gas for heating. Gas use for dehumidification is low or zero after 08-Sep-06. AHUs in the reference store ran very little after September.
- Since the reference store uses gas for both heating and cooling, swings in the gas data can result.
Lighting Energy Summaries 2006
The lighting control settings were different in the two stores previously, but the control scheme in the experimental store appears to have been switched to match the reference store by Dec-06.
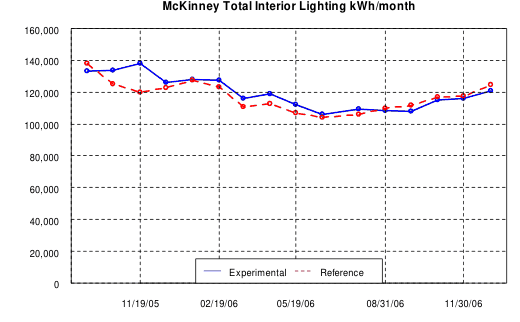
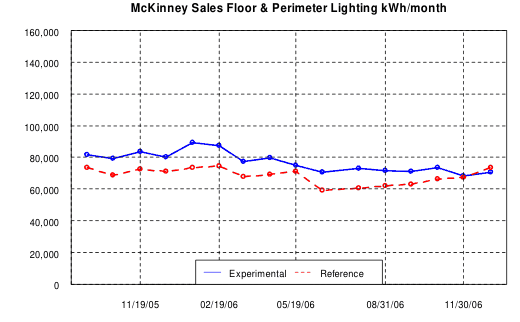
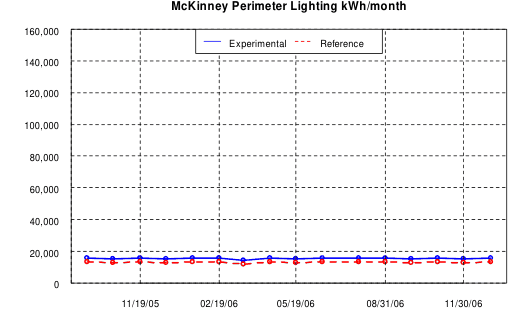
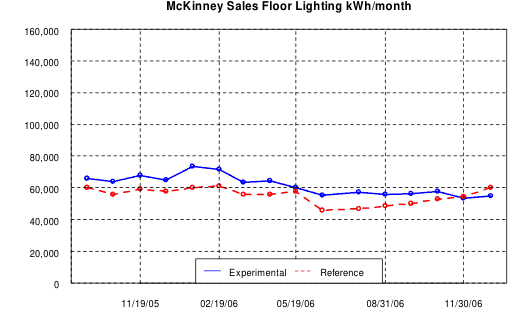
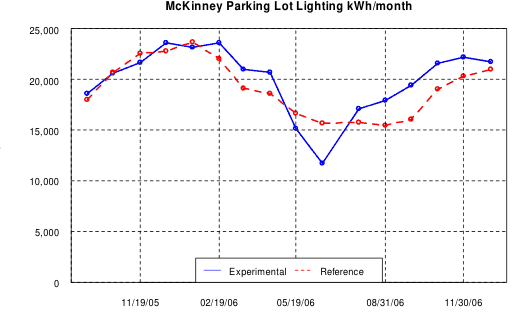
Notes:
- Expectations for lighting savings were to be developed but were never received.
- All Interior Lighting includes electricity for all interior lights on panels H1P1, H1P2, H2P2, and H4C.
- Perimeter lighting energy use is relatively low, is about the same in both stores, and is calculated, not measured.
- Sales floor lighting includes all circuits labeled Sales Floor and Dimmable Clerestory.
Renewable Energy Production Summaries 2006
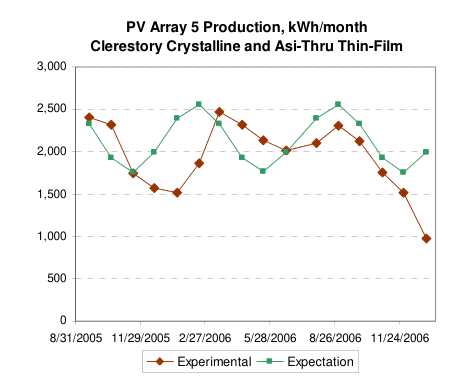
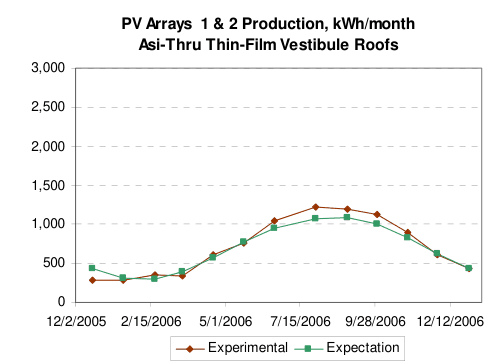
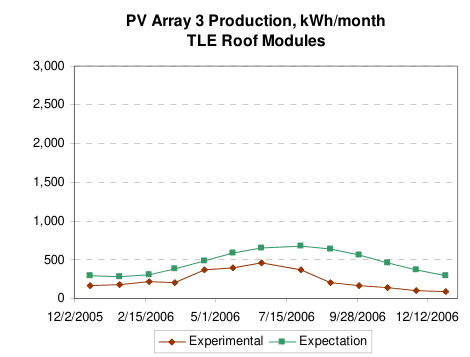
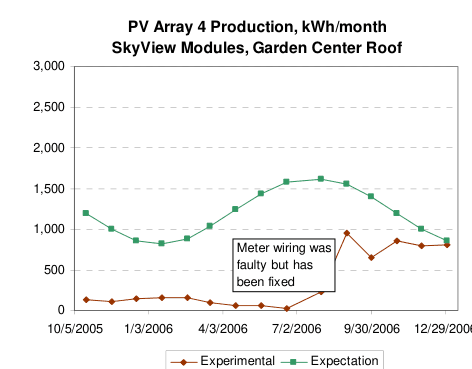
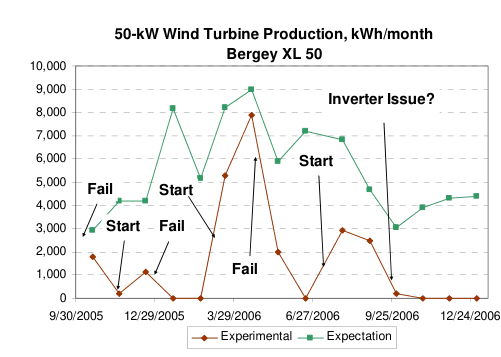
Monthly production and expected production of the photovoltaic (PV) arrays are summarized in the performance curves here. PV Array 5, Clerestory, appears to have had erratic electric meter readings at the beginning of December, so December production may be higher. The 50-kW Bergey wind turbine was running, but no power was delivered to the store beginning October 2006. The TLE roof PV system (array 3) has been verified to be producing well below expectations. PV Array 4 had a metering problem prior to October 2006.
Notes:
- The expectations for the PV systems are based on annual values developed by Solar Design Associates and simple sinusoid curves.
- PV Array 4 on the Garden Center has produced more electricity than shown, due to a metering problem prior to October 2006.
- Wind turbine expectations are based on Bergey performance data with a temporary correction to wind speed to approximate the 120-ft height reading.
2nd year Annual Performance Report for 2007 (D2.2/D4.1)
The following graphs and tables provide an overview of the energy performance of the experiments at the McKinney, Texas, experimental (#206) supercenter compared to expected performance and to the performance of the reference store (#5211) in McKinney, Texas. The second year is 2007, and data are shown for both stores with a percentage comparison.
Total Energy and Air Emissions 2007
Total energy and emissions for both stores in 2007 are covered in Table 5. The notes below the table describe the quantities listed. Higher electrification in the experimental store led to higher source energy use and higher emissions, since Texas ERCOT electricity has high emissions. As explained in the summary results for 2006, the air emissions values are in metric tons of carbon-dioxide-equivalent, where equivalency is based on global warming potential. Refrigerant leakage is not included in these calculations, and refrigerant leakage was not part of the scope of the evaluations.
| Energy End Use, kWh except where noted | Experimental Store | Reference Store | Comparison (%) |
|---|---|---|---|
| Total Facility Electricity | 6,435,636 | 5,660,377 | 14% |
| Net Facility (Purchased) Electricity | 6,374,376 | 5,660,377 | 13% |
| Natural Gas for HVAC | 1,419,359 | 1,278,130 | 11% |
| Net Facility site energy | 7,793,735 | 6,938,507 | 12% |
| Net Facility source energy | 24,901,472 | 22,132,052 | 13% |
| Net facility emissions, MT CO2e | 5,869 | 5,211 | 13% |
Table Notes:
- The Total Facility Electricity is all the electricity used in the facility, including renewables.
- HVAC natural gas does not include gas used for the bakery or food service tenant.
- Net Facility site energy is the purchased electricity plus HVAC gas.
- Net Facility Source Energy accounts for all the energy used to extract, transport, generate, and deliver purchased electricity and HVAC gas to the site. The site to source conversion factors are 3.658 for electricity in the Texas ERCOT region and 1.116 for natural gas based on 2000 national data, taken from Source Energy and Emission Factors for Energy Use in Buildings, NREL/TP-550-38617, June 2006, Deru and Torcellini, Tables 3 and 5, http://www.nrel.gov/docs/fy06osti/38617.pdf
MT CO2e Note: MT CO2e stands for metric tons of carbon-dioxide-equivalent, where a metric ton is 1,000 kg or 2,205 lb, and equivalent CO2 emissions are for energy only based on the global warming potential of 1 for CO2, 23 for CH4, and 296 for N2O. Refrigerant leakage is not included.
Natural gas use in the experimental store was higher than at the reference store in 2007 due to efforts to work out the boiler capacity and control issues at the experimental store. Boiler control changes caused the boiler to run excessively, but there were major concerns related to inadequate boiler response and resulting comfort and equipment issues at the experimental store.
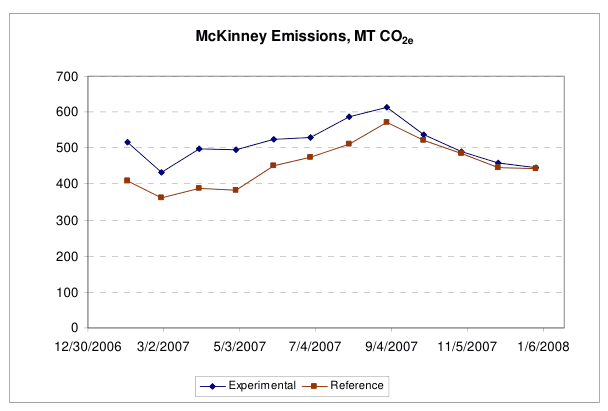
In addition to the boiler controls changes, unrelated controls changes at the reference store made 2007 the most interesting year for HVAC energy impacts, as the AHUs at the reference store ran little from October 2006 through September 2007, using about one million kWh less electricity and also less natural gas for this period as compared to other 12-month periods observed. There was some increase to in-store carbon dioxide levels as a result, but not to any improper level for any lengthy period. Relative humidity appeared to be better controlled. This energy reduction was also mentioned in the ASHRAE Journal article published in September 2007 on the McKinney and Aurora, CO, overall store performance and the refrigeration and HVAC experiments (pp 14–25).
The Figure 7 CO2 equivalent emissions indicate the large differences caused by these coinciding but unrelated controls changes. ORNL had no control over what controls changes were made or when they were made, and the reference store controls were changed again in September 2007 to cause the AHUs to again run more often and use a lot more energy.
These controls changes and observed impacts are important because closer looks at the supply air temperatures of RTUs and AHUs indicate that they are often fighting each other with heating against cooling or vice versa, and one means of eliminating this fighting is to reduce AHU runtimes drastically. In the experimental store, AHU runtimes could not be reduced, as the ductsox distribution system required the fans to run constantly to keep them inflated (more on ductsox later).
End-Use Energy Consumption Summary 2007
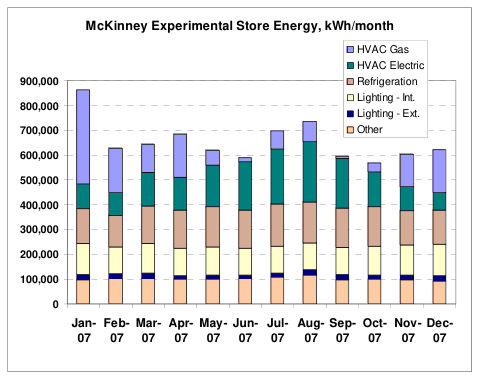
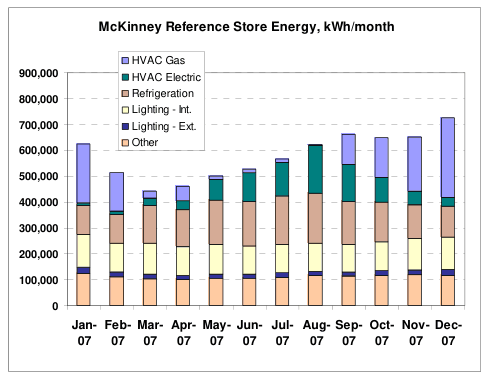
The site energy consumption by end use is shown in Figures 8 and 9 below and is listed in Table 6. The end use data in the figures is shown monthly for January 2007 through December 2007. Note the high HVAC gas use at the experimental store and the low HVAC electrical and gas use at the reference store through August 2007.
| Energy End-Use | Experimental Store (kWh) | Reference Store (kWh) | Comparison (%) |
|---|---|---|---|
| HVAC Gas | 1,419,359 | 1,278,130 | 11% |
| HVAC Electricity | 1,791,329 | 919,912 | 95% |
| Refrigeration | 1,820,769 | 1,806,767 | 1% |
| Interior Lighting | 1,371,804 | 1,371,530 | 0% |
| Parking Lot Lighting | 221,900 | 222,464 | 0% |
| Other Electrical Loads | 1,215,822 | 1,339,704 | -9% |
Notes:
- The data presented here do include renewable electricity generated at the site, but do NOT include energy from waste oil burned, or gas used for the store bakery or food service tenant. Values do include electricity used by the bakery and all tenants.
- The HVAC Gas for the Experimental store includes the natural gas used in the natural gas boiler. The HVAC Gas for the Reference store includes the gas used in the rooftop units, central air handlers, and infrared heaters.
- The HVAC Electricity for the Experimental store includes the electrical energy used in the rooftop units, central air handlers, and pumps (air curtain heaters are not really used in the experimental store, and the reference store has gas infrared heaters). The HVAC Electricity for the Reference store includes the electricity used in the rooftop units, and central air handlers, although the central air handlers did not run much this year.
- The Other Electrical Loads includes all electricity use in the building that is not part of the other measurements.
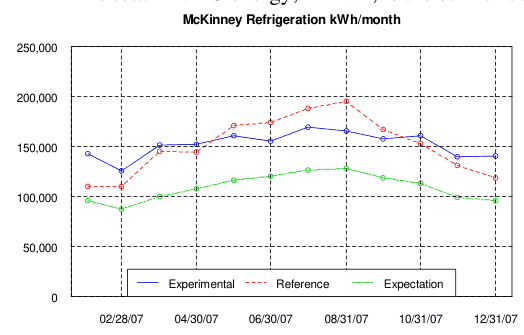
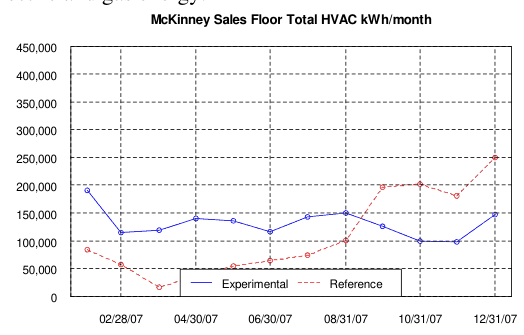
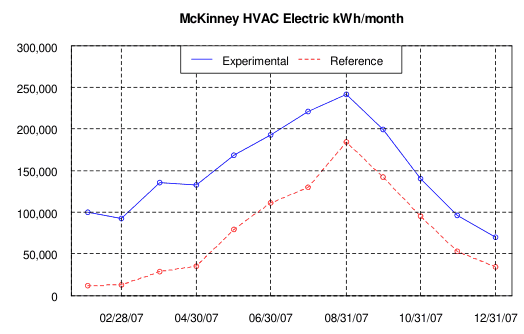
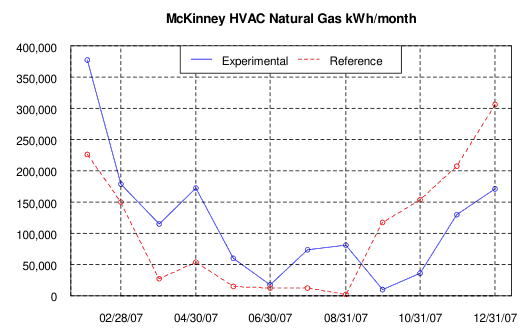
Refrigeration and HVAC Energy Summaries 2007
The total HVAC energy, in kWh, is the sum of both electric and gas energy.
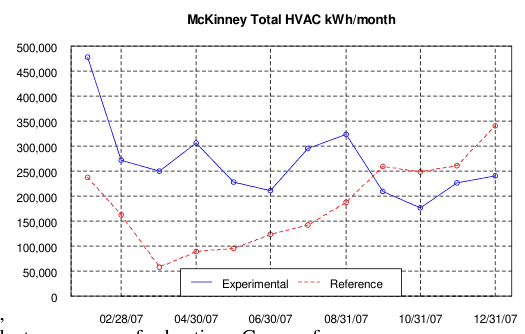
Notes:
- The expectations for refrigeration performance from VaCom, 12-15-06, that better match the actual systems, are in the green curve above.
- HVAC natural gas does not include gas used for the bakery or food service tenant.
- HVAC electricity includes the air handler units and rooftop units, as well as the pumps for the experimental store.
- Sales floor total HVAC energy is gas and electricity used by the AHUs and RTUs serving the main sales floor.
- The reference store uses gas for dehumidification, while the experimental store uses electricity. Both stores use gas for heating. Gas use for dehumidification is low or zero after 08-Sep-06. AHUs in the reference store ran very little after September.
- Since the reference store uses gas for both heating and cooling, swings in the gas data can result.
- Preliminary total volatile organic compound (total VOC or TVOC) readings were taken in July 2007. Outdoor values were typically 0.15–0.25 ppm, while indoor values were typically 0.1 ppm in the evening and 0.15–0.25 in the morning at both stores. Apparently, bakery/cooking operations affect TVOC more than product / packaging offgassing at both stores, and some factor(s) appears to reduce TVOC inside relative to ground level outside. Readings were taken in ppb with a Rae Systems ppbRAE meter.
Lighting Energy Summaries 2007
The lighting control settings were different in the two stores previously, but the control scheme in the experimental store appears to have been switched to match the reference store now.
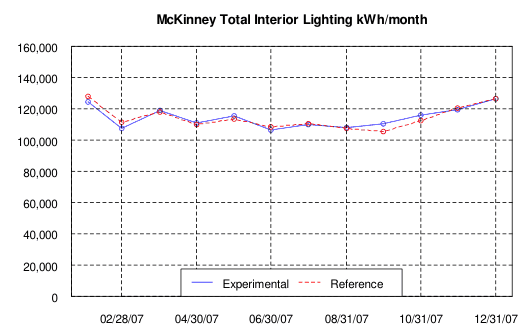
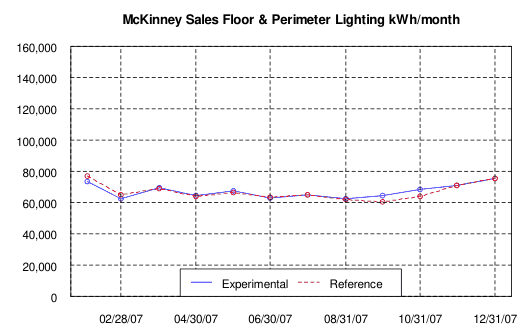
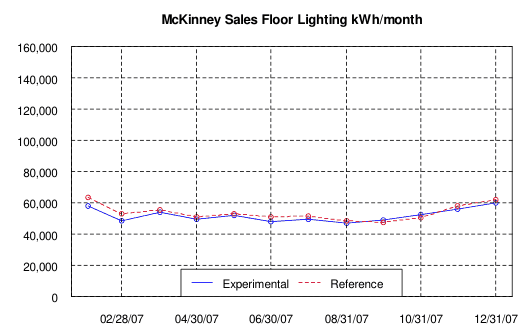
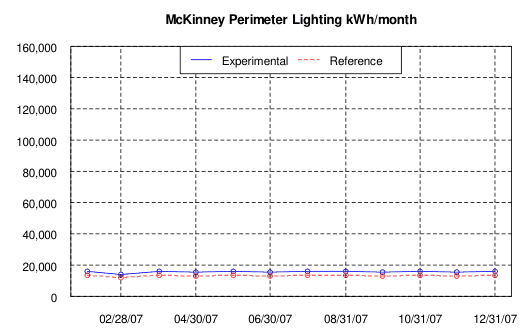
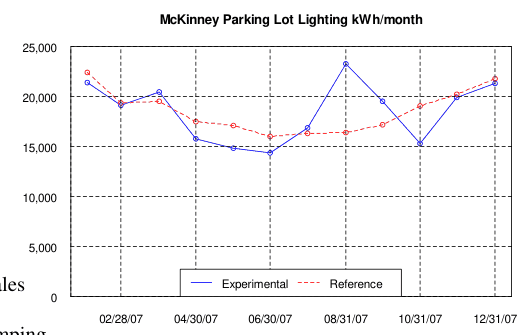
Notes:
- Expectations for lighting savings were to be developed but were never received.
- All Interior Lighting includes electricity for all interior lights on panels H1P1, H1P2, H2P2, and H4C.
- Perimeter lighting energy use is relatively low, is about the same in both stores, and is calculated, not measured.
- Sales floor lighting includes all circuits labeled Sales Floor and Dimmable Clerestory.
- Outdoor lighting at both stores is affected by relamping.
Renewable Energy Production Summaries 2007
Monthly production and expected production of the photovoltaic (PV) arrays are summarized in the performance curves here. The 50-kW Bergey wind turbine continued to have inverter problems. PV Array 4 on the Garden Center had some issues with “fogging” condensation inside the glazing during the Summer.
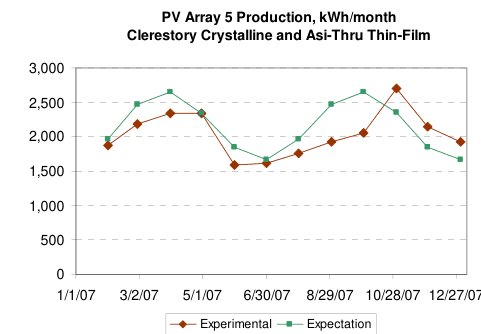
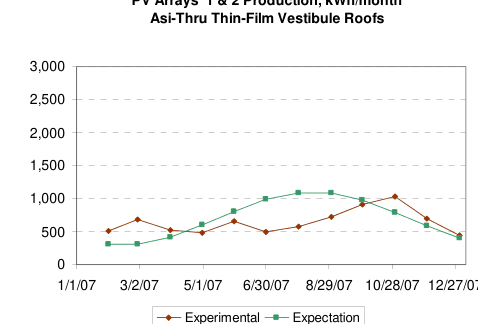
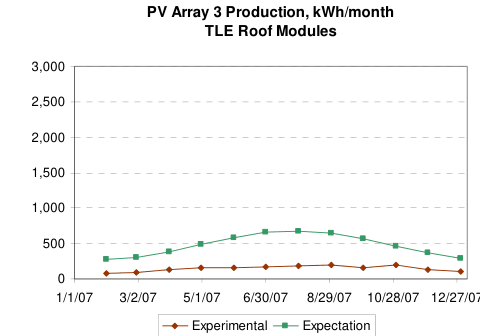
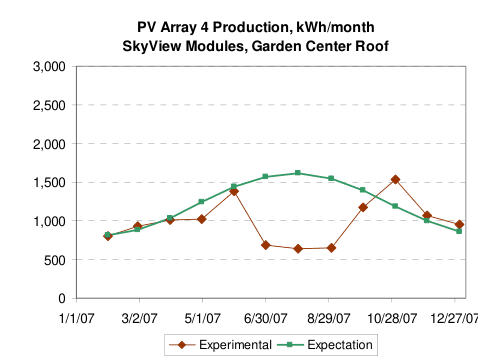
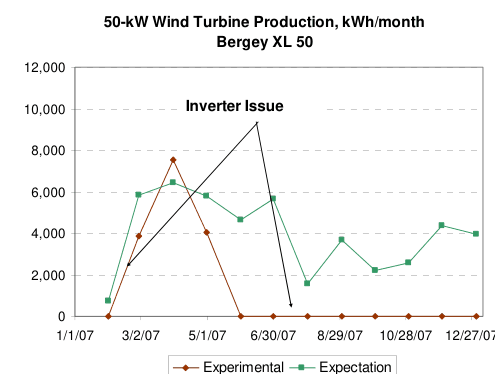
Notes:
- The expectations for the PV systems are based on annual values developed by Solar Design Associates and simple sinusoid curves.
- Wind turbine expectations are based on Bergey performance data with a temporary correction to wind speed to approximate the 120-ft height reading.
3rd year Annual Performance Report for 2008 (D2.3/D4.1)
The following graphs and tables provide an overview of the energy performance of the experiments at the McKinney, Texas, experimental (#206) supercenter compared to expected performance and to the performance of the reference store (#5211) in McKinney, Texas. The third and final year of energy monitoring is 2008, and data are shown for both stores with a percentage comparison.
Total Energy and Air Emissions 2008
Total energy and emissions for both stores in 2008 are covered in Table 7. The notes below the table describe the quantities listed. Higher electrification in the experimental store led to higher source energy use and higher emissions, since Texas ERCOT electricity has high emissions. As explained in the summary results for 2006, the air emissions values are in metric tons of carbon-dioxide-equivalent, where equivalency is based on global warming potential. Refrigerant leakage is not included in these calculations, and refrigerant leakage was not part of the scope of the evaluations.
| Energy End Use, kWh except where noted | Experimental Store | Reference Store | Comparison (%) |
|---|---|---|---|
| Total Facility Electricity | 6,254,088 | 5,827,175 | 7% |
| Net Facility (Purchased) Electricity | 6,171,276 | 5,827,175 | 6% |
| Natural Gas for HVAC | 1,079,206 | 2,280,988 | -53% |
| Net Facility site energy | 7,250,482 | 8,108,163 | -11% |
| Net Facility source energy | 23,753,020 | 23,806,646 | 0% |
| Net facility emissions, MT CO2e | 5,196 | 4,959 | 5% |
Table Notes:
- The Total Facility Electricity is all the electricity used in the facility, including renewables.
- HVAC natural gas does not include gas used for the bakery or food service tenant.
- Net Facility site energy is the purchased electricity plus HVAC gas.
- Net Facility Source Energy accounts for all the energy used to extract, transport, generate, and deliver purchased electricity and HVAC gas to the site. The site to source conversion factors are 3.658 for electricity in the Texas ERCOT region and 1.092 for natural gas based on 2005 national data, taken from Source Energy and Emission Factors for Energy Use in Buildings, NREL/TP-550-38617, June 2007, Deru and Torcellini, Tables 3 and 6, http://www.nrel.gov/docs/fy07osti/38617.pdf
MT CO2e Note: MT CO2e stands for metric tons of carbon-dioxide-equivalent, where a metric ton is 1,000 kg or 2,205 lb, and equivalent CO2 emissions are for energy only based on the global warming potential of 1 for CO2, 23 for CH4, and 296 for N2O. Refrigerant leakage is not included.
As can be seen from Figure 10 and the end use data in Figures 11 and 12, boiler control at the experimental store was set to a more final and reasonable state.
In addition, with the control change at the reference store that caused AHUs to run more often, HVAC electricity and gas use at the reference store increased significantly, causing total air emissions at the experimental store to be closer (5% more in 2008 vs 13% more in 2007). Source energy use was the same at the experimental store for 2008 compared to the reference store.
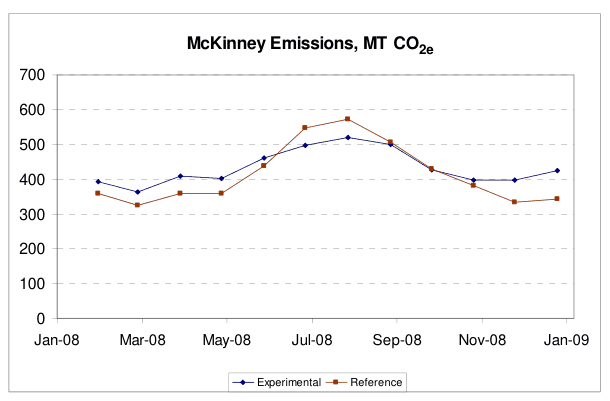
End-Use Energy Consumption Summary 2008
The site energy consumption by end use is shown in Figures 11 and 12 below and is listed in Table 8. The end use data in the figures is shown monthly for January through December 2008.
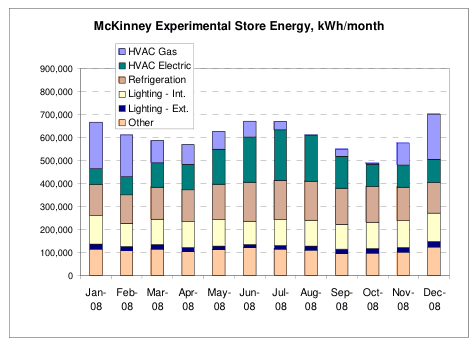
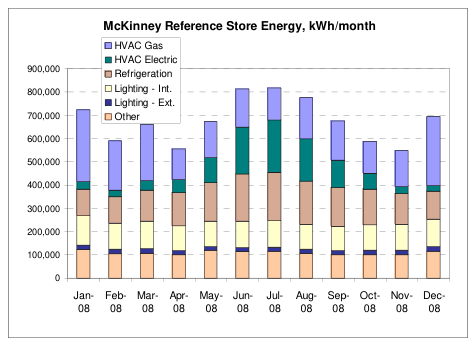
| Energy End-Use | Experimental Store (kWh) | Reference Store (kWh) | Comparison (%) |
|---|---|---|---|
| HVAC Gas | 1,079,206 | 2,280,988 | -53% |
| HVAC Electricity | 1,565,098 | 1,111,690 | 41% |
| Refrigeration | 1,784,354 | 1,834,948 | -3% |
| Interior Lighting | 1,353,990 | 1,351,798 | 0% |
| Parking Lot Lighting | 224,987 | 216,480 | 4% |
| Other Electrical Loads | 1,325,660 | 1,312,260 | 1% |
Notes:
- The data presented here do include renewable electricity generated at the site, but do NOT include energy from waste oil burned, or gas used for the store bakery or food service tenant. Values do include electricity used by the bakery and all tenants.
- The HVAC Gas for the Experimental store includes the natural gas used in the natural gas boiler. The HVAC Gas for the Reference store includes the gas used in the rooftop units, central air handlers, and infrared heaters.
- The HVAC Electricity for the Experimental store includes the electrical energy used in the rooftop units, central air handlers, and pumps (air curtain heaters are not really used in the experimental store, and the reference store has gas infrared heaters). The HVAC Electricity for the Reference store includes the electricity used in the rooftop units and central air handlers.
- The Other Electrical Loads includes all electricity use in the building that is not part of the other measurements.
Refrigeration and HVAC Energy Summaries 2008
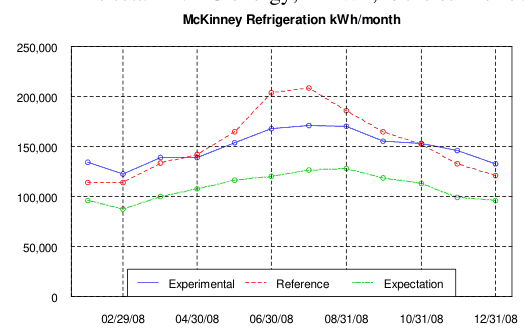
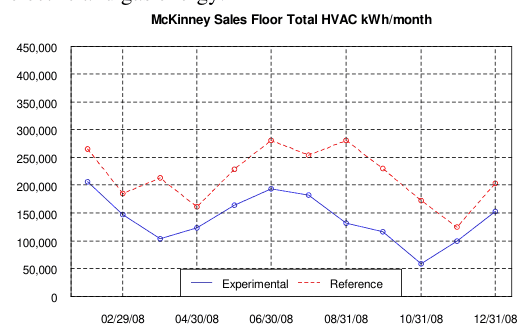
The total HVAC energy, in kWh, is the sum of both electric and gas energy.
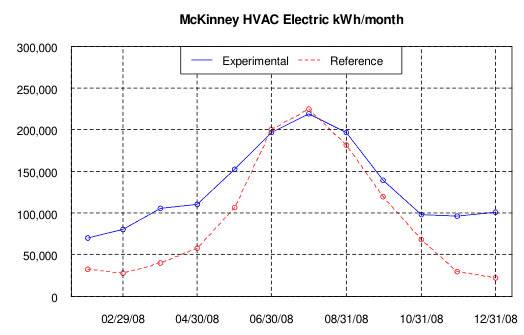
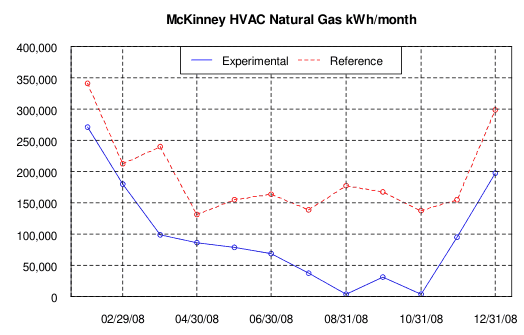
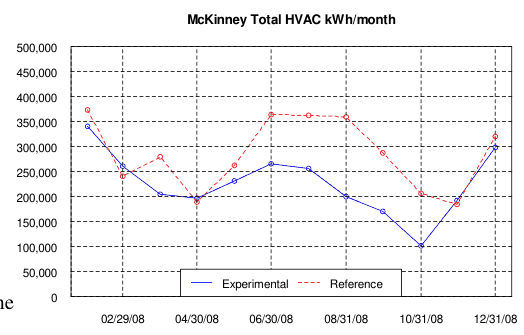
Notes:
- The expectations for refrigeration performance from VaCom, 12-15-06, are in the green curve above.
- Expectations for HVAC savings were to be developed for Wal-Mart by others.
- HVAC natural gas does not include gas used for the bakery or food service tenant.
- HVAC electricity includes the air handler units and rooftop units, as well as the pumps for the experimental store.
- Sales floor total HVAC energy is gas and electricity used by the AHUs and RTUs serving the main sales floor.
- CO2 concentrations at both stores were controlled mostly at 400–800 ppm this year, with some brief and infrequent excursions to 900-1000 ppm, more typically for holiday periods Nov–Jan.
Lighting Energy Summaries 2008
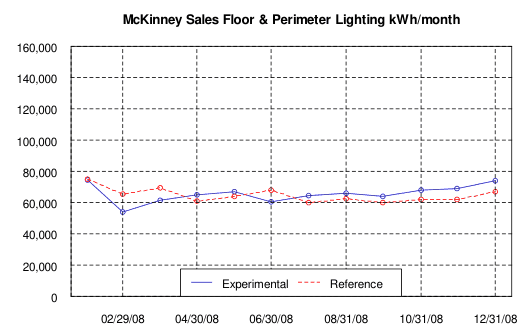
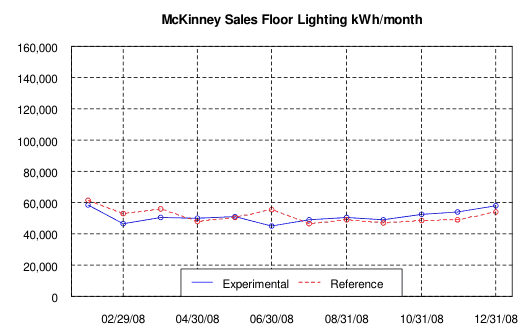
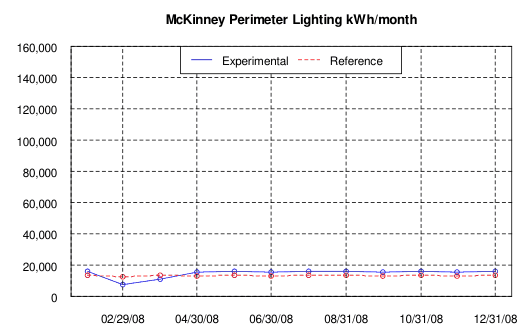
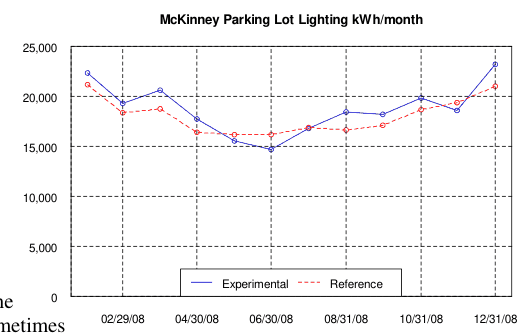
The lighting control settings in the experimental store remained similar to the reference store. The last few months, the amount of dimming in the experimental store was reducing. Lamp replacement needs affect lighting energy at both stores at different times.
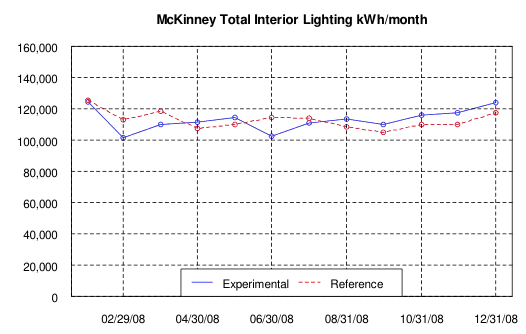
Notes:
- Expectations for lighting savings were to be developed but were never received.
- All Interior Lighting includes electricity for all interior lights on panels H1P1, H1P2, H2P2, and H4C.
- Perimeter lighting energy use is relatively low, is about the same in both stores, and is calculated, not measured.
- Sales floor lighting includes all circuits labeled Sales Floor and Dimmable Clerestory.
- Outdoor lighting at both stores is affected by relamping needs and control of 8 lamps outside the TLE at the reference store (sometimes off and sometimes on).
Renewable Energy Production Summaries 2008
Monthly production and expected production of the photovoltaic (PV) arrays and 50-kW wind turbine are summarized in the performance curves here. PV arrays 1&2 appeared to suffer from dirt / mildew buildup before November 2008. PV array 4 appeared to have condensation issues again. PV array 5 may have had some dirt / mildew buildup issues.
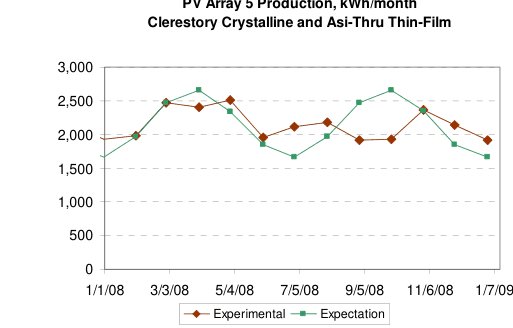
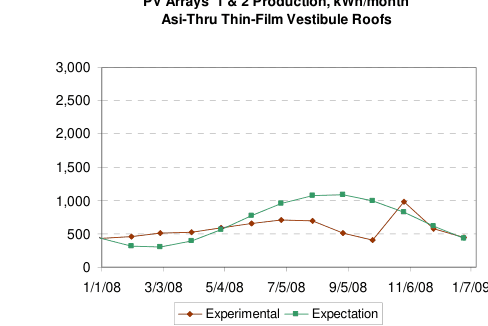
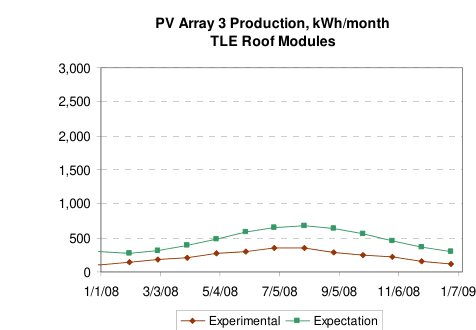
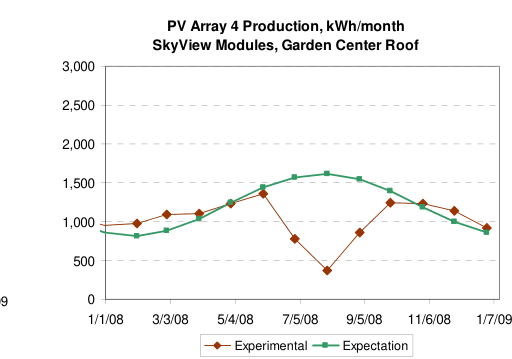
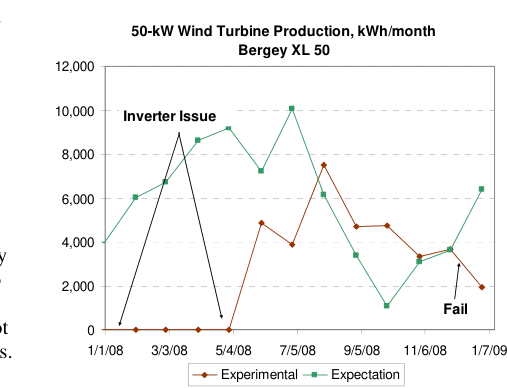
Notes:
- The expectations for the PV systems are based on annual values developed by Solar Design Associates and simple sinusoid curves, so weather effects like cloudiness are not calculated.
- PV Array 3 has been verified to be delivering below expectations, but Uni-Solar measured panel performance and verified that the panels are working well, so inverter checks appear needed.
- Wind turbine expectations are based on Bergey performance data with an interim correction to wind speed to approximate the 120-ft height wind speed, but the expectations curve may not adequately reflect real wind conditions at times.
Environmental Impact Assessments (D3 / D3.1 / D3.4)
Some of the environmental impact results are reported under Overall Store Performance Reports (D2.4). Air emissions results (D3.1) were reported in that section of the report (previous section). Air emissions results are reported for all three years of monitoring, 2006–2008. This section constitutes the final report on environmental impacts (D3.4).
Impacts on Water (D3.2)
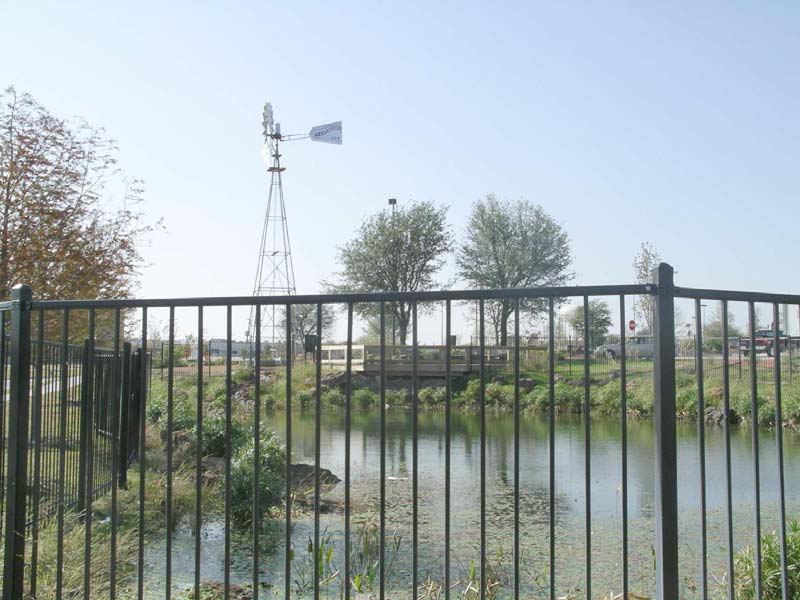
Impacts on water (D3.2) will be presented here for the entire three-year period, although the SOW is only for the second year. Water impacts were to revolve around use of drip irrigation and the pond and wetlands developed at the site. As the picture below shows, taken in late 2005, the wetlands looked in good shape (view from walkway between the pond and wetlands). Unfortunately, a construction adjustment to the pond left a leak in the liner that caused problems for almost the entire three-year monitoring period.
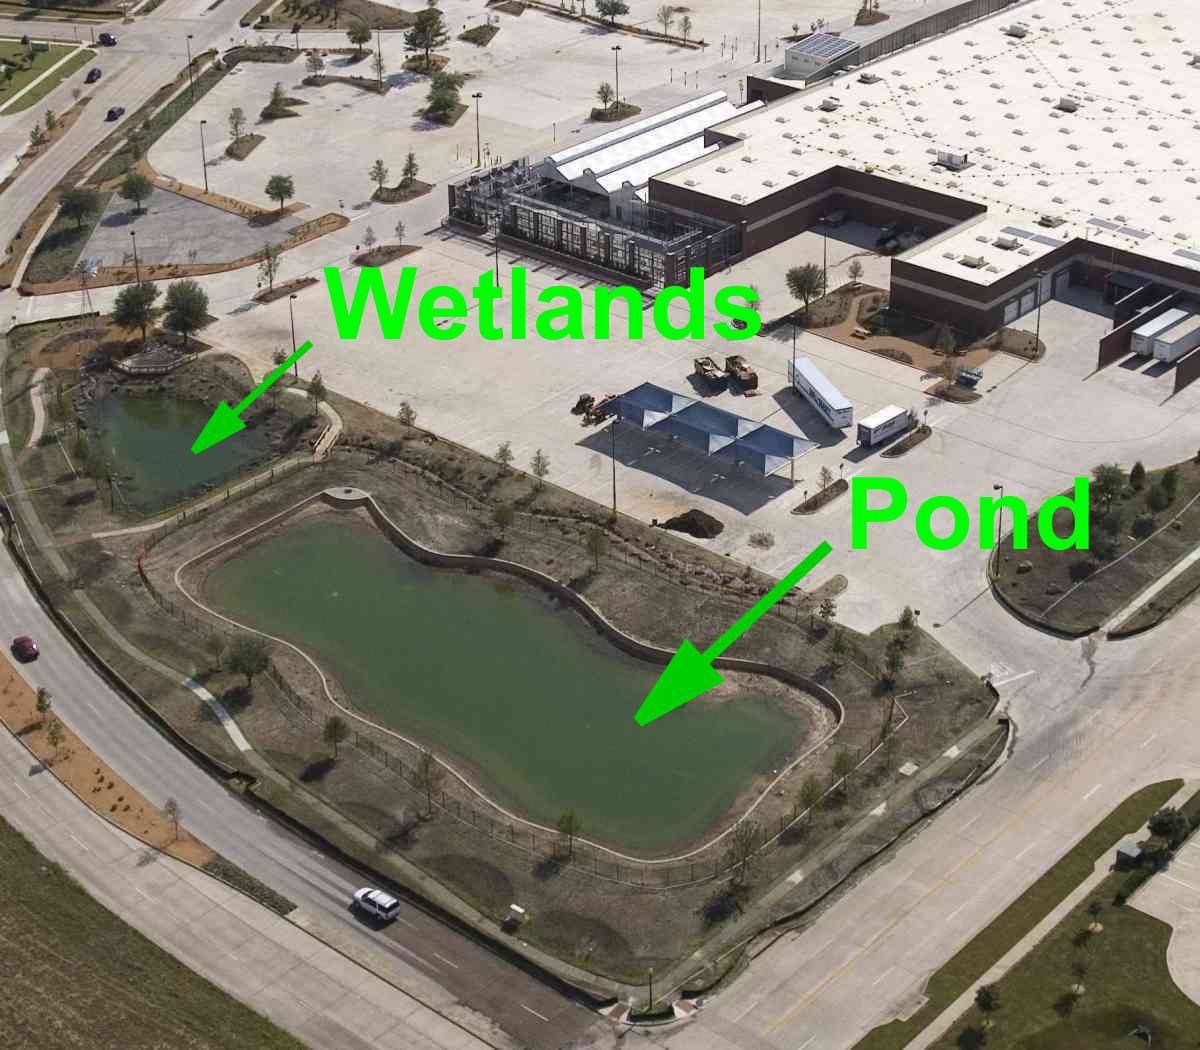
Thus, water environmental impacts reporting became subject to fixing the pond. The next picture shows an aerial view of the McKinney experimental site on the side with the water features just before grand opening (July 2005). The pond and wetlands areas are labeled on the picture.
Primary responsibility for reporting on water impacts belongs to Kimley-Horn Associates, the Civil Engineering team member. Dan Millner was the primary contact for Kimley-Horn on the McKinney project. ORNL meteorological data collected at the site as part of the project were supplied to Millner as needed to use in development of a water retention / rainwater model of the site. This water model is used to verify and predict water performance for the site.
Water performance in this North Texas climate is affected by decisions on when and how much to irrigate the grass or landscape at a supercenter site. Table 9 shows the irrigation and domestic water use at both the experimental and reference store sites for October 2005 through December 2008. The erratic use of irrigation water at the reference store caused percentage comparisons to move around a lot. Efforts to deal with the pond leaks at the experimental store caused large variations in irrigation water use. Water data are from the City of McKinney utility data.
| Billing Month | Experimental Irrigation | Experimental Domestic | Reference Irrigation | Reference Domestic | Irrigation Comparison | Domestic Comparison |
|---|---|---|---|---|---|---|
| October 2005 | 18,235,000 | 173,000 | 849,000 | 316,000 | – – | -45% |
| November 2005 | 2,313,000 | 335,000 | 1,328,000 | 260,000 | 74% | 29% |
| December 2005 | 840,000 | 569,000 | 841,000 | 233,000 | 0% | 144% |
| January 2006 | 1,659,000 | 517,000 | 770,000 | 261,000 | 115% | 98% |
| February 2006 | 1,599,000 | 627,000 | 950,000 | 273,000 | 68% | 130% |
| March 2006 | 639,000 | 548,000 | 460,000 | 243,000 | 39% | 126% |
| April 2006 | 120,000 | 696,000 | 1,041,000 | 290,000 | -88% | 140% |
| May 2006 | 121,000 | 366,000 | 1,128,000 | 154,000 | -89% | 138% |
| June 2006 | 196,000 | 430,000 | 892,000 | 168,000 | -78% | 156% |
| July 2006 | 333,000 | 589,000 | 1,235,000 | 252,000 | -73% | 134% |
| August 2006 | 609,000 | 681,000 | 905,000 | 254,000 | -33% | 168% |
| September 2006 | 393,000 | 899,000 | 389,000 | 274,000 | 1% | 228% |
| October 2006 | 326,000 | 586,000 | 396,000 | 219,000 | -18% | 168% |
| November 2006 | 270,000 | 386,000 | 390,000 | 209,000 | -31% | 85% |
| December 2006 | 164,000 | 457,000 | 253,000 | 292,000 | -35% | 57% |
| January 2007 | 131,000 | 444,000 | 201,000 | 219,000 | -35% | 103% |
| February 2007 | 7,000 | 365,000 | 83,000 | 233,000 | -92% | 57% |
| March 2007 | 9,000 | 327,000 | 36,000 | 194,000 | -75% | 69% |
| April 2007 | 9,000 | 422,000 | 35,000 | 227,000 | -74% | 86% |
| May 2007 | 38,000 | 389,000 | 9,000 | 217,000 | 322% | 79% |
| June 2007 | 37,000 | 410,000 | 14,000 | 205,000 | 164% | 100% |
| July 2007 | 17,000 | 396,000 | 7,000 | 190,000 | 143% | 108% |
| August 2007 | 73,000 | 346,000 | 432,000 | 381,000 | -83% | -9% |
| September 2007 | 173,000 | 342,000 | 583,000 | 252,000 | -70% | 36% |
| October 2007 | 22,000 | 301,000 | 548,000 | 234,000 | -96% | 29% |
| November 2007 | 19,000 | 359,000 | 4,000 | 218,000 | 375% | 65% |
| December 2007 | 10,000 | 299,000 | 0 | 292,000 | #DIV/0! | 57% |
| January 2008 | 2,030,000 | 349,000 | 0 | 213,000 | #DIV/0! | 64% |
| February 2008 | 2,000 | 292,000 | 2,000 | 195,000 | 0% | 50% |
| March 2008 | 2,000 | 331,000 | 4,000 | 203,000 | -50% | 63% |
| April 2008 | 404,000 | 357,000 | 18,000 | 208,000 | 2144% | 72% |
| May 2008 | 448,000 | 407,000 | 29,000 | 232,000 | 1445% | 75% |
| June 2008 | 31,000 | 319,000 | 37,000 | 241,000 | -16% | 32% |
| July 2008 | 812,000 | 380,000 | 16,000 | 239,000 | 4975% | 59% |
| August 2008 | 264,000 | 418,000 | 508,000 | 279,000 | -48% | 50% |
| September 2008 | 196,000 | 265,000 | 614,000 | 0 | -68% | #DIV/0! |
| October 2008 | 288,000 | 352,000 | 598,000 | 435,000 | -52% | -19% |
| November 2008 | 250,000 | 286,000 | 329,000 | 588,000 | -24% | -51% |
| December 2008 | 73,000 | 294,000 | 0 | 259,000 | #DIV/0! | 14% |
Notes:
- The expectations for irrigation water were 90% savings if the pond system is working. Substantial monthly savings up to 90% are seen in some months for xeriscape and drip irrigation alone, but the reference store irrigation water use dropped dramatically after 2006.
- Commissioning of the drip irrigation water system appears to have taken about nine months.
- Domestic water use at the experimental store includes makeup water to the cooling towers.
- A water meter change appears to have caused the peculiar domestic water reading for the reference store in September 2008.
Impacts on Land (D3.3)
Experimental activities relative to landscape and land features (D3.3) were ongoing during the experimental period and are the responsibility of the Landscape Architect, John Murphy, and the Natural Resources Consultant: Steve Clark & Associates, Inc. (SCA). Murphy and SCA were responsible for reporting and evaluation of the land impacts, and ORNL had no involvement in this area, so impacts on land are not reported here. Reporting responsibilities for specific experiments are listed in the table in the Background section at the beginning of this report. Wal-Mart continued to use Murphy and SCA for several additional land-related initiatives at a wide range of sites.
Evaluation of Individual Measures (D4)
This section provides the final reports on individual measures that were included in the original experiment list, information on the retrofits made at the end of the experimental period, and additional supporting information related to other energy measures and energy use. The report on the energy performance of the entire store (whole supercenter, D4.1) is presented as the entire section on Overall Store Performance Reports previously (D2). The reporting situation for landscaping, park, and wetlands (D4.13) is covered in the previous section on environmental impacts.
Commercial Refrigeration (D4.8/D4.10)
Wal-Mart has conducted extensive studies of grocery refrigeration systems efficiency and effectiveness and is continually working to improve performance. The refrigeration system is one of the largest energy consumers in a typical supercenter. At McKinney, the refrigeration systems were redesigned from air-cooled ground-mounted units to water-cooled roof-mounted units with cooling towers. By relocating the refrigeration systems to the roof, the amounts of copper piping and refrigerant charge were reduced. Use of water-cooled condensers is intended to reduce the total energy use by reducing the saturated condensing temperature.
The condensers are connected to two evaporative cooling towers for heat rejection. The evaporative cooling towers use an advanced, electromagnetic, pulsed-power water treatment system that eliminates use of water treatment chemicals and biocides and reduces blowdown. Use of cooling towers increases water use at the store, but reduced electricity use helps reduce water use at the electric power plants that generate the electricity.
More efficient refrigerated display fixtures
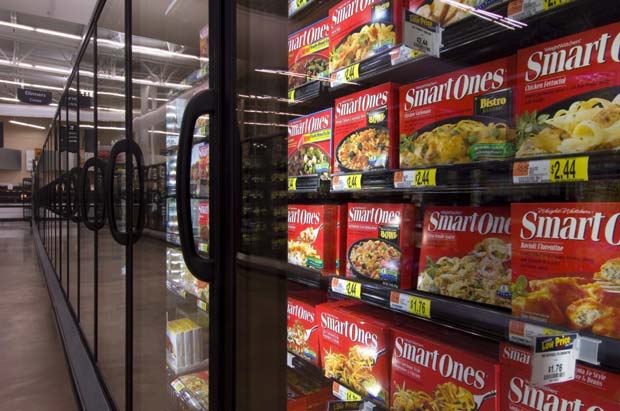
The refrigerated fixtures were made more efficient by combining high-efficiency, enhanced coil surfaces in the fixtures and electrically commutated high efficiency fan/motor packs in the medium-temperature cases. These features reduce the energy consumption by the fixtures and result in higher required saturated suction temperatures for individual fixtures, resulting in lower peak power demand needed to operate the fixtures. The low-temperature glass door display fixtures are equipped with 1st-generation LED lighting in place of fluorescent strip fixtures. LED lights have a longer life span than fluorescent lights, produce less heat due to less light needed to effectively illuminate the product, and thus use less energy than typical grocery case lighting. In addition, while fluorescent lights usually cast a yellow or blue hue, using 5000K LED lighting enables the human eye to perceive the true colors of the grocery products.
Waste heat recovery / utilization (D4.10)
In this SuperCenter, heat generated by the building’s refrigeration system was intended to be captured and redirected to heat the water in the hydronic system and restroom hot water.
Refrigeration cases with doors
Typically, medium temperature refrigerated display cases (for deli, dairy, beverages, fresh meat, etc.) in typical supermarkets and supercenters don’t have doors, so the refrigerated air spills out into the store aisles, which means the refrigeration system has to work harder (using more energy) to keep the food cold. Glass doors were used on most of the McKinney Supercenter’s display cases keep the cold air in and reduce energy consumption.
Results
The LED lighting was an instant winner, providing improved product appearance in most cases, and began to be applied routinely for supercenter refrigeration. Later LED technology improvements have led to additional significant electricity savings for all newer cases or case retrofits. Energy data from McKinney indicated electricity savings of 15–20% relative to the reference store for the case lighting (35,000–50,000 kWh/yr). Case doors help keep the lights cooler, which increases their performance. The combination of case doors, and advanced motors and enhanced heat exchange, led to a savings of about 80,000 kWh/yr for the case improvements other than lighting, relative to the reference store (about 25% savings).
Waste heat recovery (D4.10) was indicated to have many problems. One issue was that the heat did not appear to be “waste” heat, but instead was obtained by keeping refrigerant pressures higher than otherwise. Also, the piping systems in the store were very complicated, and all the systems were difficult to keep working correctly, due to all the inter-connections. At times the data showed heat was being pumped back into the refrigeration system, instead of being recovered from the refrigeration. Despite the other energy-saving features of the refrigeration system components, the compressor racks consistently used more electricity than the reference store, which reduced overall refrigeration savings (see Tables 4, 6, and 8). Wal-Mart performed several retrofits at the experimental store in 2009, including removal of the waste heat recovery system.
Finally, use of water-cooled condensers led to lower energy use in hot weather and higher energy use in cold weather relative to the reference store air-cooled units. The water-cooled units at the experimental store actually used less electricity at the racks than total rack electricity at the reference store in the hottest weather, but in the coldest weather used 50–90% more electricity. Improved ability to operate the water-cooled systems at lower condensing temperatures appeared to be needed.
Desiccant system (D4.11)
The heating systems at the experimental store differ from the reference store in that hot water coils are used in the rooftop units (RTUs) and the Munters air handler ventilation systems (AHUs). At the reference store the RTUs have gas furnace sections to provide heat.
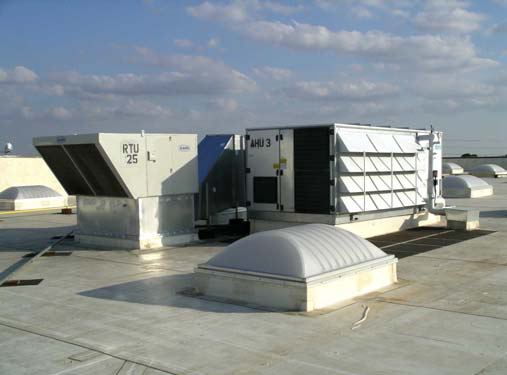
For cooling, the RTUs at the experimental store are similar to those at the reference store, except the fans must run all the time to keep the ductsox (see subsection in this section titled “Displacement ventilation (D4.12)”) inflated, while at the reference store the RTUs only run when the thermostat calls for cooling or heating. Dehumidification is primarily handled by the AHUs at both stores, with the units at the reference store having natural gas-fired regeneration and the units at the experimental store using the heat of the refrigeration compressors for regeneration. The AHUs at the experimental store required an additional (add-on) RTU to feed cooler air to the intake for the units to function correctly.
The difference in dehumidification approaches may provide one of the major differences between the two stores. Gas use at the reference store was quite high before the experimental monitoring started, and the gas burners were found to be locked “on.” These units were “unlocked” for the experimental monitoring period.
Results
All the heating and cooling results (HVAC energy) are confounded by several factors:
- Major problems with control of the gas boiler in the experimental store caused controls testing and validation procedures in 2007 to send gas use very high at the experimental store
- AHU control at the reference store varied from amazing reductions in HVAC energy used during Oct-2006 thru Sep-2007, while
- More typical AHU control at the reference store in 2006 made 2006 the most comparable year, even though the months of Oct–Dec had major reductions in HVAC energy
- A turnaround in strategy at the reference store after Sep-07 caused HVAC energy at the reference store to increase significantly
- Heating and cooling controls changes at the experimental store in the last half of 2008 caused significant drops in HVAC electricity use
Even if the electric-only desiccant system (regeneration from heat of compressors) used less total kWh of site energy (energy used to generate and transport the fuel sources NOT included), total source energy (generation and transport energy included) will typically be higher, since electric source energy is typically over three times the site energy, while gas is only about 5% higher. In addition, air emissions will typically be higher, since emissions for electricity use are usually much higher than for gas energy.
Total HVAC (site) energy (electric plus gas) at the experimental store was 100,000 kWh less than at the reference store in 2006, 1 Million kWh more in 2007, and 750,000 kWh less in 2008. This wide variation corresponds to the factors listed above.
As indicated above, the RTU and AHU fans have to run continuously to keep the ductsox air distribution system inflated. Running the fans continuously also caused HVAC electricity in the experimental store to be higher than if the fans did not have to run continuously. One partial improvement is to install variable speed capabilities for the fan motors to allow them to run at lower speeds and using less energy most of the time (more information on variable speed improvements in the next subsection in this section titled “Displacement ventilation (D4.12)”).
Displacement ventilation (D4.12)
The experimental store was designed with a “low velocity thermal displacement system.” The system uses fabric ducts (ductsox) which have many small holes that distribute an even air flow along the entire length of the duct, rather than from a single register. The ducts are mounted 11 feet above the floor and distribute the supplied air at low velocity, where the air slowly falls to the floor and is warmed by the occupants and other heat sources. Warm air is supposed to slowly rise through the store to be drawn out by the air conditioning units.
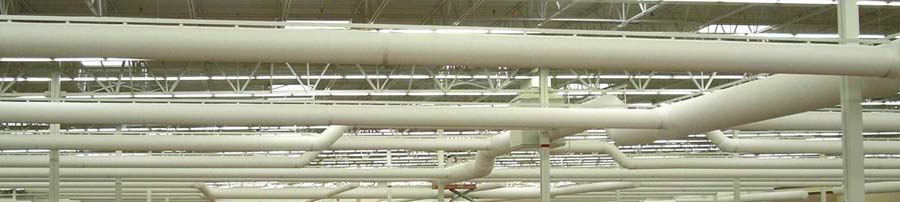
A computational fluid dynamics (CFD) analysis was performed to determine that the design would:
- Perform as intended
- Meet the requirements for temperature distribution in the store
- Improve design by optimizing supply temperature and volumetric flow rate
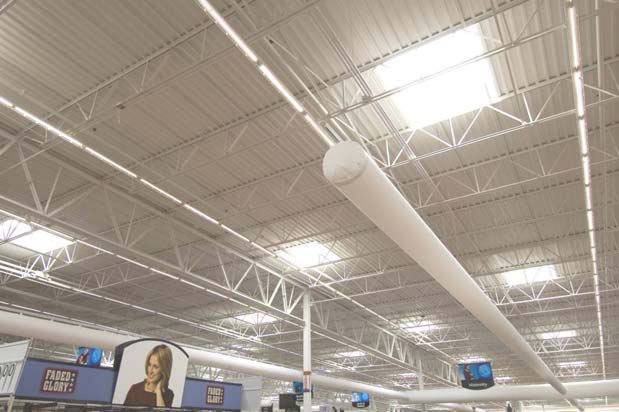
The design team also used the CFD analysis to optimize the supply air temperature and flow rate. Supply air temperature for best cooling performance was indicated to be moderate (65°F) compared to typical overhead systems (55°F). Initial calculations indicated energy savings of up to 25% may be possible using this approach.
Displacement ventilation systems have several potential advantages over typical cold-air mixing systems. Due to the thermal stratification and high-level return, the majority of the lighting load and roof heat gain directly heats the return air rather than the lower conditioned zone. In this situation, these loads do not contribute to occupied zone loads. Also, with elevated supply air temperature and elevated return air temperature, the air handling unit will have an extended economizer range compared to systems supplying at 55°F and returning at 75°F. The extended economizer range would also result in significant energy savings. System performance and energy use was to be compared to the reference store that has a standard, overhead plenum-box air distribution system.
Of significance in this approach is Wal-Mart’s now standard use of large, dedicated dehumidification systems in their stores. With the dehumidification load handled by the air handler units (AHUs), the other cooling units can have enhanced energy efficiency by supplying air that is less cool, while the AHUs could handle the task of maintaining acceptable humidity conditions. Special attention to humidity control is now considered highly important by system designers around the country to reduce mold, mildew, and odors, and achieving energy efficiency improvements at the same time is also important for environmental benefits.
Measurement Approach
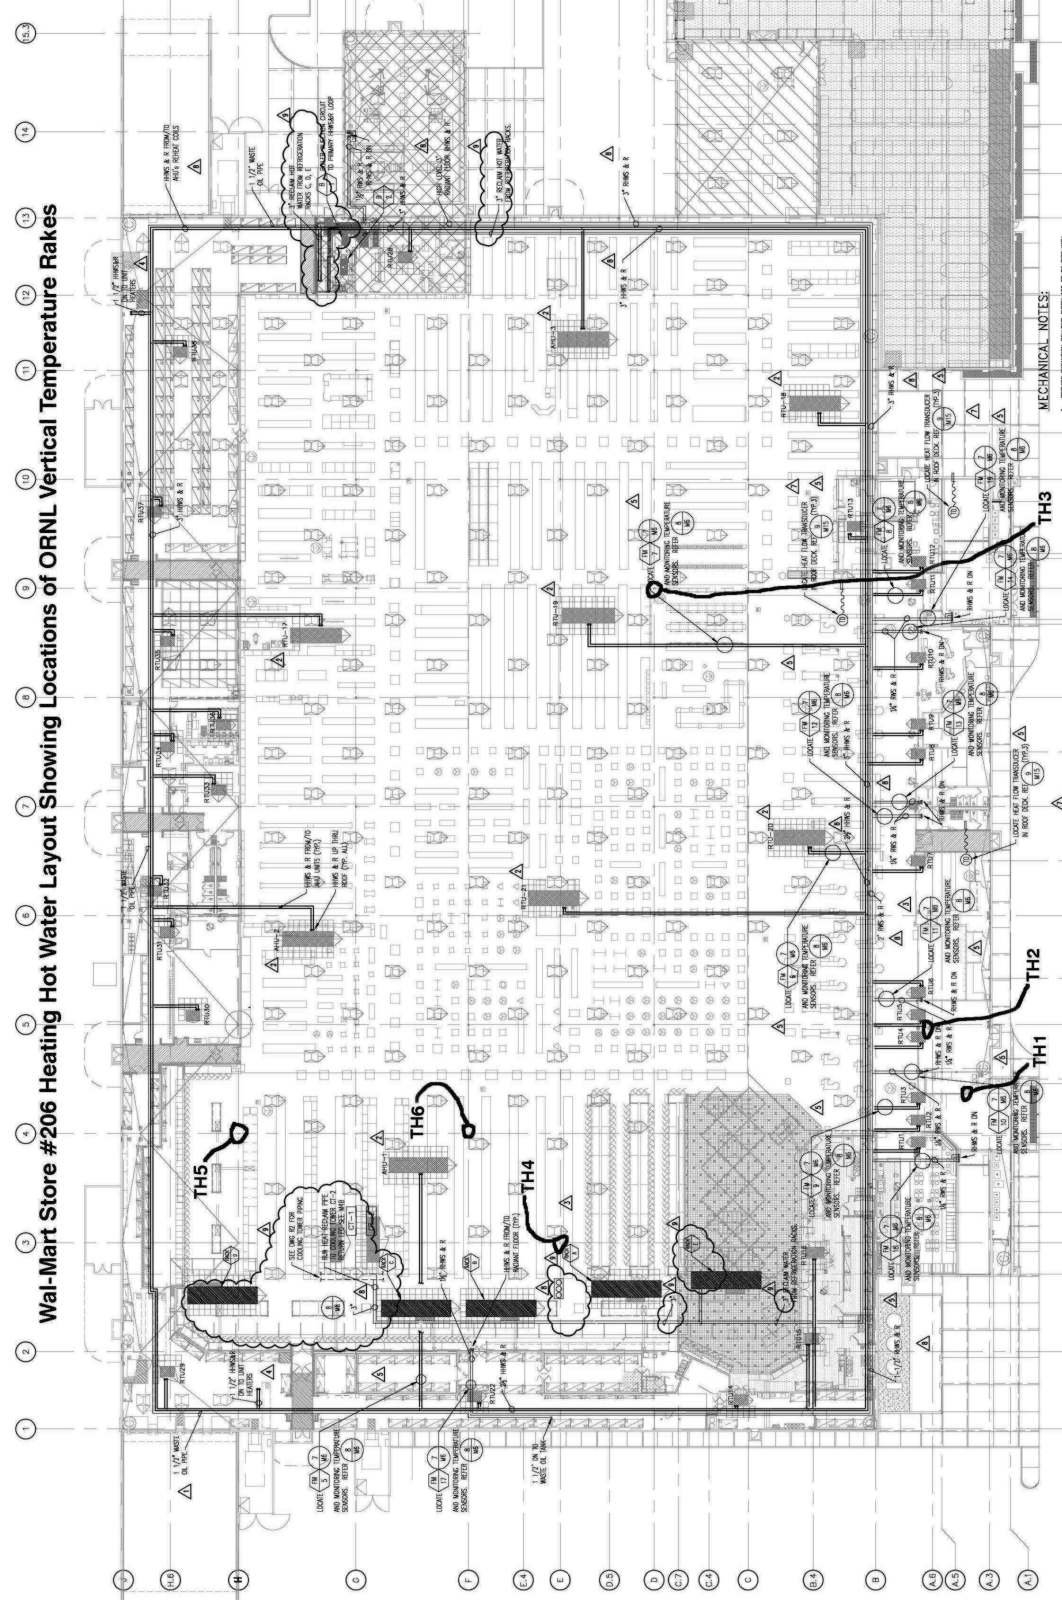
Temperature monitoring stations or rakes (TH1 through TH6) and humidity sensors are installed in both the experimental store and the reference store in the same locations as shown in the drawing figure, next page, for the experimental store. The temperature rakes sense temperatures at intervals from the 1-ft level up to the roof deck, with some variations. Relative humidity is sensed at one elevation above the floor, about the 7-ft level.
Stratification
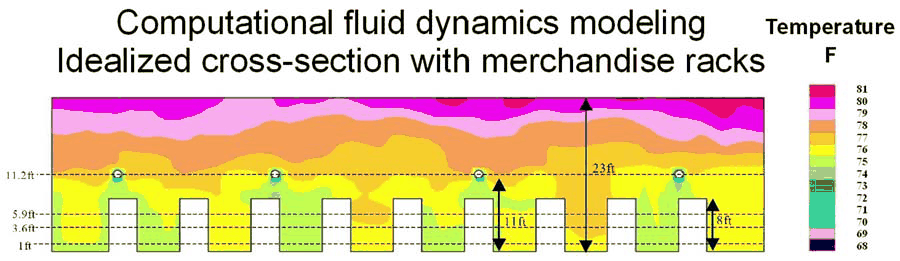
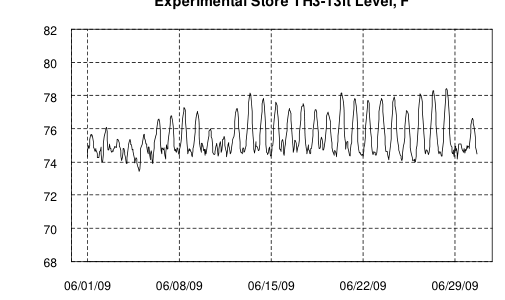
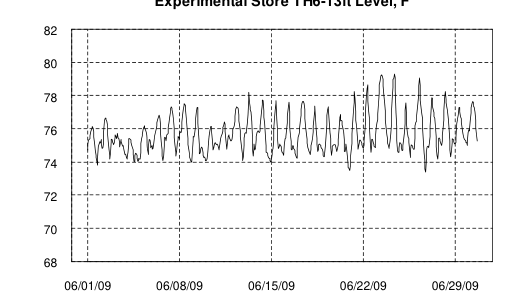
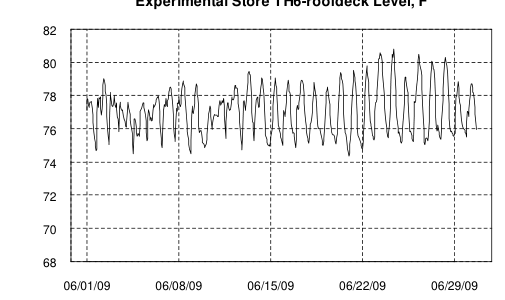
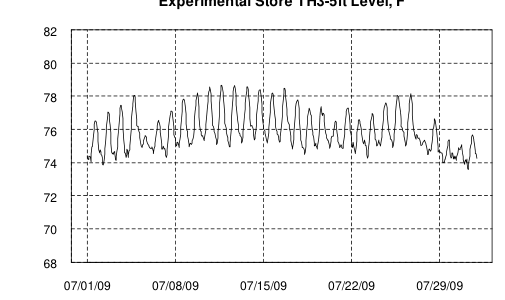
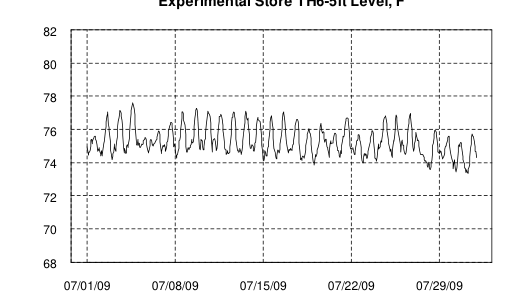
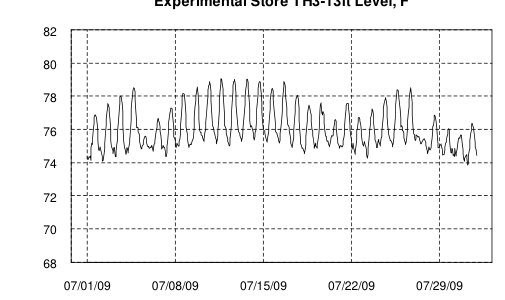
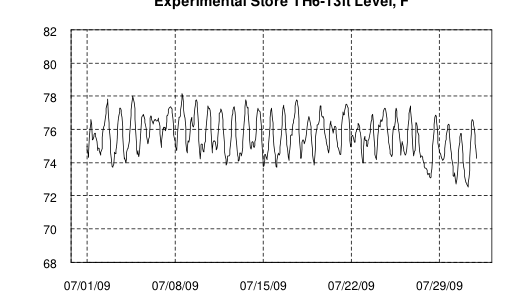
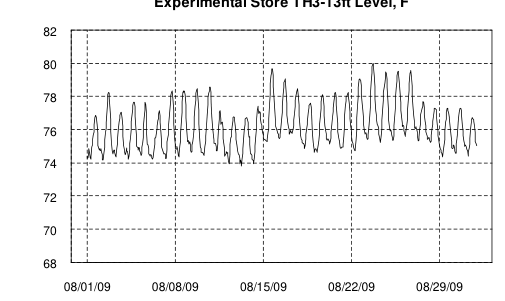
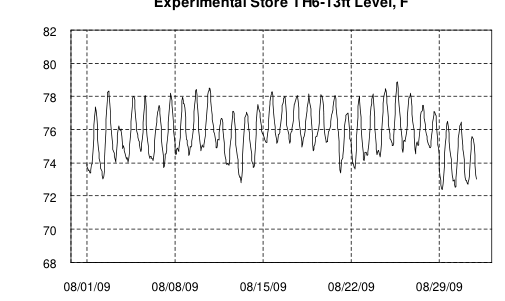
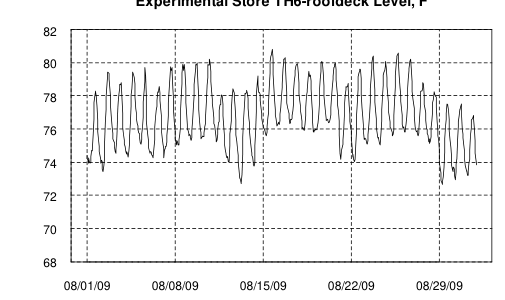
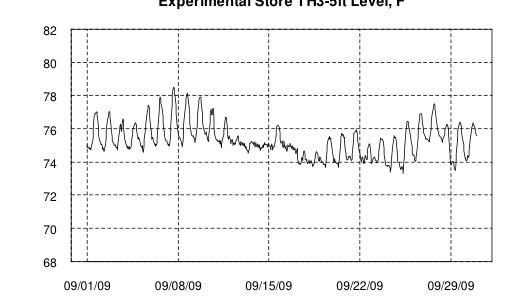
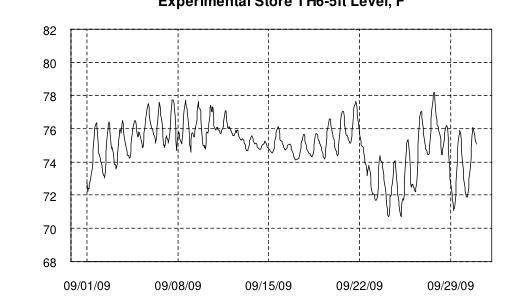
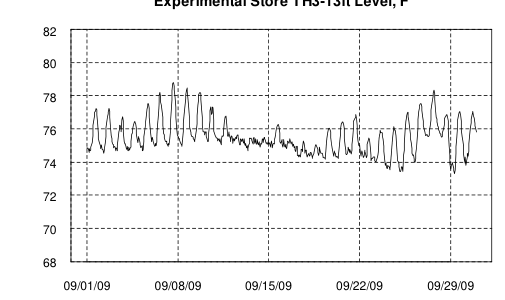
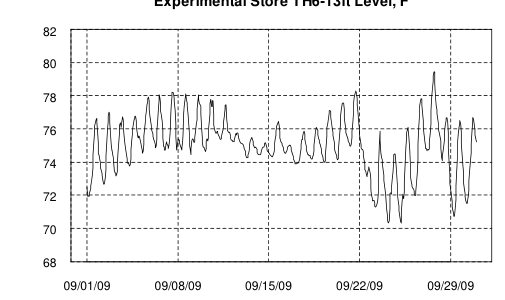
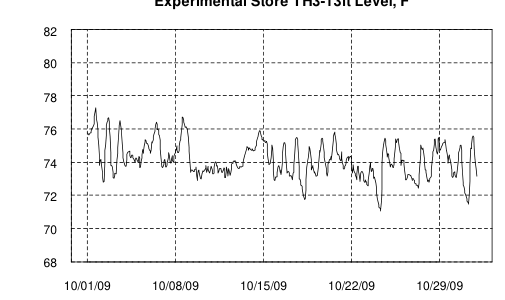
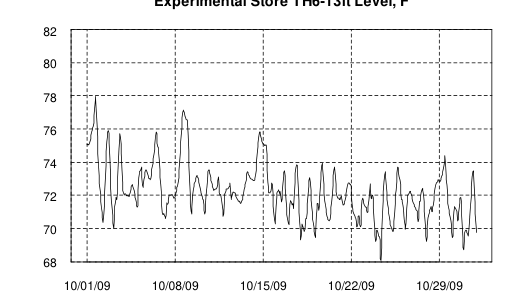
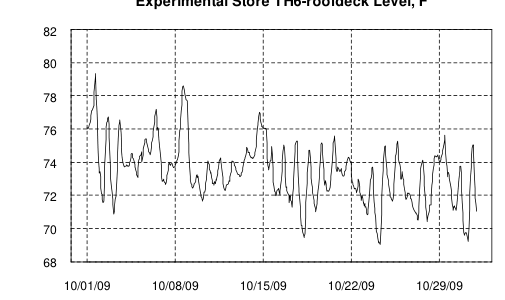
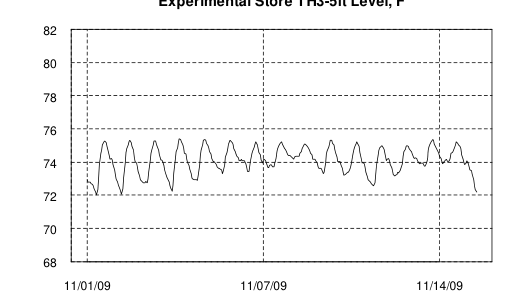
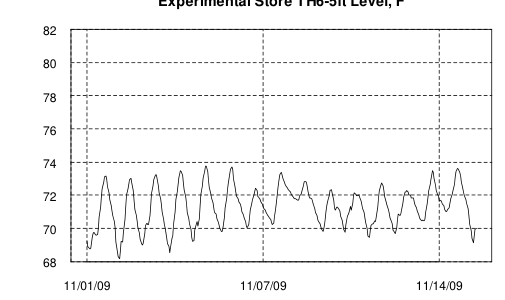
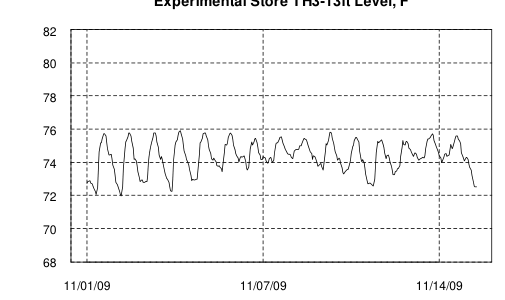
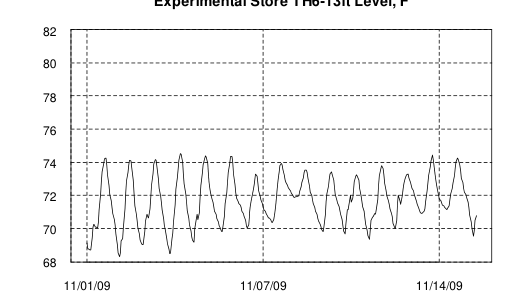
The displacement ventilation strategy depends on a stratified warm air layer remaining at the top of the store, so the temperature rakes provided temperatures at several elevations, with TH3 and TH6 rakes as most representative of the main store interior, and TH4 and TH5 providing results for the grocery area. The grocery vestibule was measured by TH1, and just inside the grocery vestibule was measured by TH2. CFD modeling showed complex temperature profiles at single points in time (see figure), and at times this stratification was achieved, but it was not maintained throughout a day.
Results
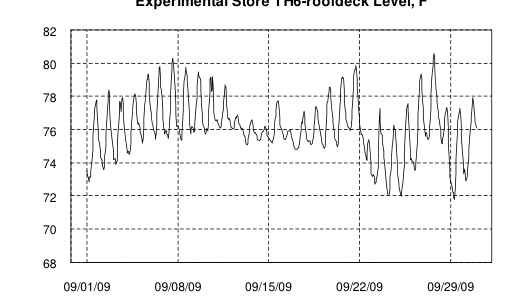
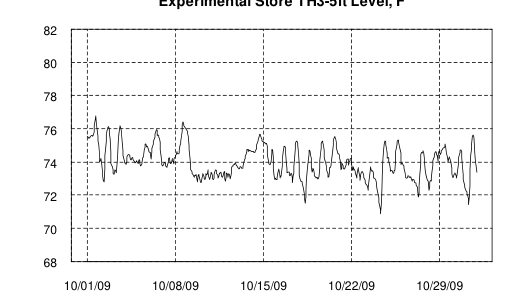
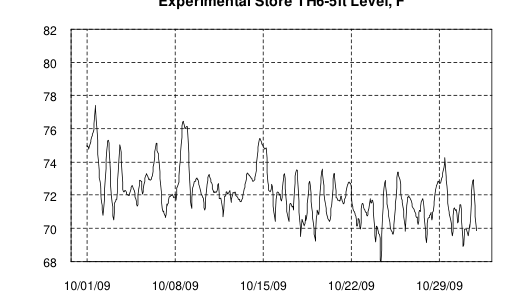
Temperatures at key heights in the temperature rake were compared each month on an hourly basis. As indicated, stratification was achieved for part of a day but not continuously. Initially the return air inlets for the rooftop units and AHUs were up at the roof deck, which meant air was continually pulled up through the anticipated stratification boundary, making stratification more difficult. Midway through the three-year period, the AHU and RTU return air arrangements were modified, with return ducts added to lower the return air location down to about 10 feet. Variable-speed drives (VFDs) were also to have been installed in the main (larger) RTUs and in the AHUs, but the RTUs did not receive VFDs until 2009. The temperature data showed that these changes increased stratification during some occupied hours, but stratification would still disappear overnight.
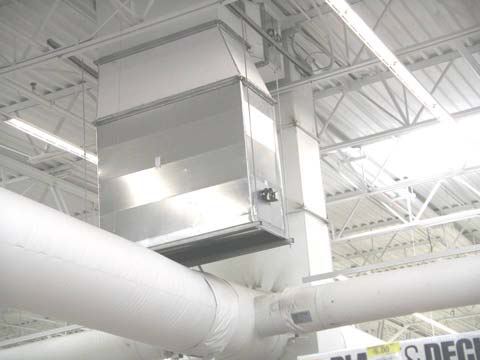
In 2009, several retrofits were made at the McKinney store, including one directly related to the RTUs and this measure, and a second related to stopping tearing of the fabric duct (ductsox) in some locations. The changes to reduce wear on the ductsox in the front of the store (sales area) were:
- Modify supply air ductwork at AHU-3 and RTU-18 and RTU-19 to reduce turbulence and reduce wear on fabric duct system
- Replace the tee’s at units per the drawings.
These changes are not expected to affect temperatures. The change related to potential stratification was to convert the RTUs to variable speed:
- Install variable frequency drives (VFDs) on the supply fans of Rooftop Units RTU-17 through 21.
- Internal wiring of each unit shall be modified to incorporate the VFD.
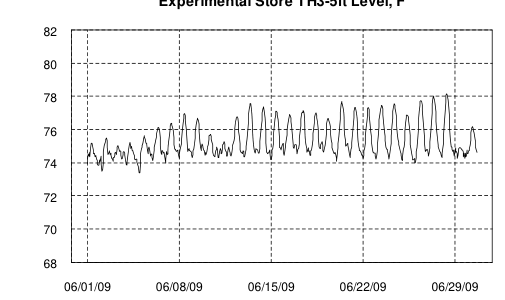
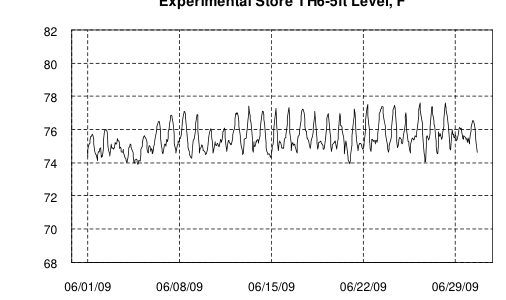
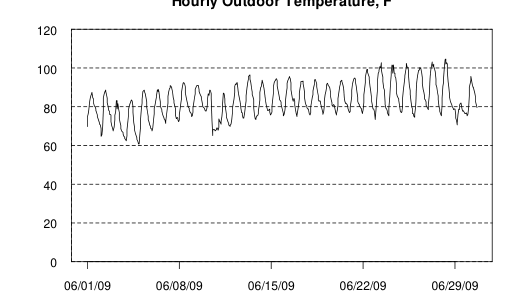
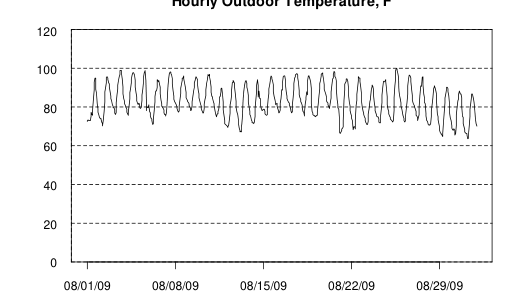
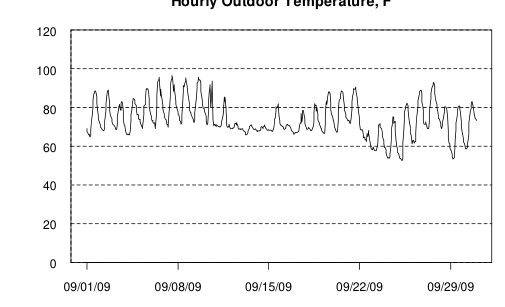
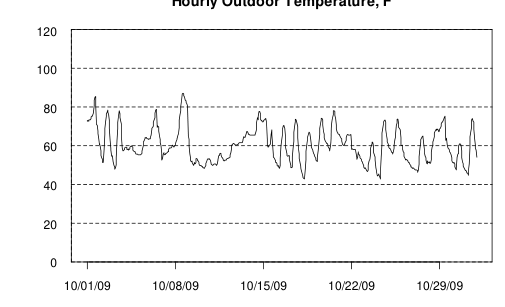
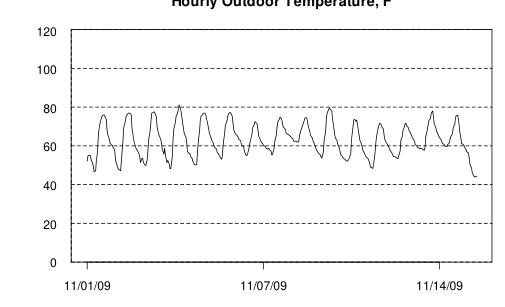
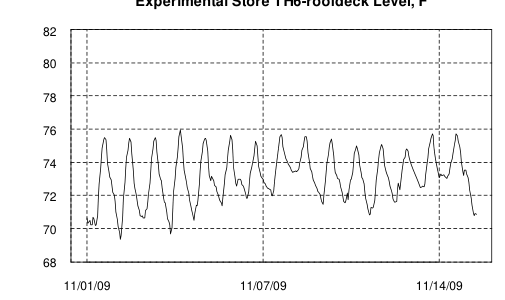
The additional VFD modifications would potentially help with stratification, if there are not other factors causing stratification to be eliminated, such as leaks in return ducts or to the outside through other roof openings. The VFD retrofits would also be expected to help with temperature control, although that topic is not part of the experimental evaluation. Plots of key temperature rake sensing point variations for June through mid-November 2009 are shown on the next several pages for reference. The data do not indicate that stratification is maintained throughout a day.
Stratification Plots for June 2009
Stratification Plots for July 2009
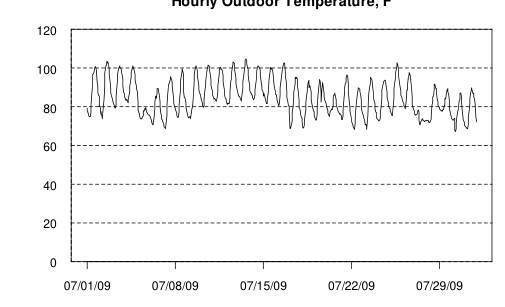
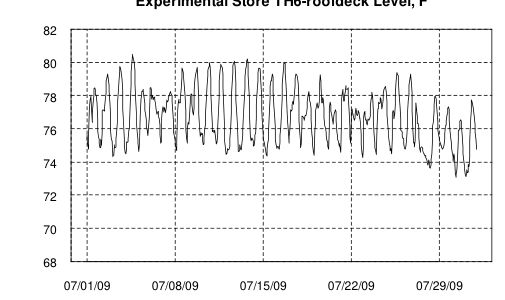
Stratification Plots for August 2009
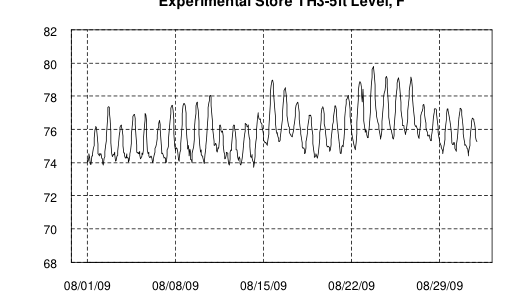
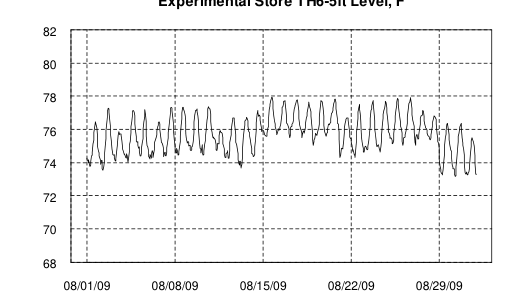
Stratification Plots for September 2009
Stratification Plots for October 2009
Stratification Plots through mid-November 2009
HVAC Electric Use Savings
The RTU VFD retrofits were described in the previous section on displacement ventilation. Another retrofit measure in 2009 related to HVAC energy was the removal of all the air curtains in the vestibules of the experimental store. Both these retrofits were expected to save HVAC electricity use.
The displacement ventilation section of this report also mentioned the HVAC retrofits to the AHUs in 2008. Additional controls changes also were and are made on an irregular basis. The HVAC changes in 2008 and 2009 led to HVAC electricity savings in each year, and while the savings can be seen in submetered HVAC electricity use data, the savings can also be seen in total store electricity data. HVAC electricity was reduced by 226,000 kWh in 2008 compared to 2007 (see Tables 6 and 8), and the approximately 200,000 kWh/yr savings can be seen in 12-month rolling sums of store purchased electricity use from the C&I Billing website (electric utility data), as shown in the graph here.
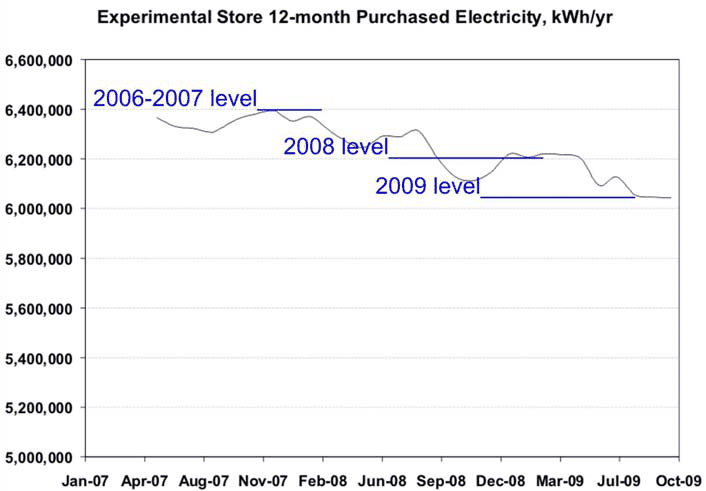
The additional HVAC retrofit savings in 2009 are indicated to be approximately 180,000 kWh/yr in the figure here, which brings total HVAC electricity savings relative to the 2006–2007 period to over 400,000 kWh/yr.
Radiant floor heating and cooling and hydronic system
Specific areas of this building have a radiant floor heating/cooling system to improve comfort while reducing energy consumption. A radiant floor heating system conducts heat by pumping hot water through a series of tubes in the concrete floor. The slab, warmed by the water, then radiates warmth to the store occupants. Radiant heat has a unique benefit: in the same way it feels comfortable standing in the sun on a cool day. Additionally, since radiant energy warms so effectively, HVAC controls can be set at a lower temperature in winter in those areas.
The radiant floor heating provides warm floors in colder weather at the checkout area, entrances, grocery frozen food aisles, and the auto service center (where service pit walls will also be warmed).
In checkout areas, associates are sometimes uncomfortable in the winter months, given their proximity to the main entrances and their sedentary work. The radiant floor serves to keep both them and store patrons warm in the winter. Radiant floors at the freezer case areas are intended to provide improved comfort all year, without increasing the temperature of the air.
Vestibule radiant floor performance will be covered briefly in the next section, “Building Envelope Features.” Control of the radiant floors was an issue, as sometimes floors would be too warm when not desirable and sometimes would not be warm when needed. The radiant floors (/walls) were not evaluated in detail during the experimental period, but the vestibule and checkout floors do help make the front of the store very comfortable in the winter.
Overall energy performance was tied to boiler / hydronic system performance. Boiler performance issues have been discussed briefly previously. Overall hydronic system performance was difficult to understand due to the complicated piping system and multiple interconnected systems (e.g., heat recovery). Simple comparison of boiler gas use to energy delivered by the hydronic system show that often only 30% or less of the HVAC gas energy was being delivered by the hydronic system to the store in the winter. Seasonal boiler efficiency, which includes cycling losses and was not measured but may have been low, was part of this difference, and piping loop losses in the mechanical room also appeared to be another contributor. One example of piping loop losses was when heat was pumped into the refrigeration system from the hydronic system via the waste heat recovery system. As mentioned previously, one of the retrofits in 2009 was to remove the waste heat recovery system from the store.
Building Envelope Features
The building envelope has several features related to energy and environmental issues. A reflective coating was added to the paint on the west face of the building to reduce the solar thermal heat gain inside the store from this wall. The increased reflectance saves energy by reducing heat entering the store through the wall to help the store stay cooler.
Cool Walls
Measurement of potential energy savings from this measure was not possible, as the analysis of potential savings in different climates for “Cool Walls” below shows. This analysis was based on the more typical layout as found in the reference store, where the AHUs have gas-fired dehumidification. The very small savings are hard to isolate. The savings for Dallas (McKinney area), with all the walls reflective, are estimated at less than $200/yr.
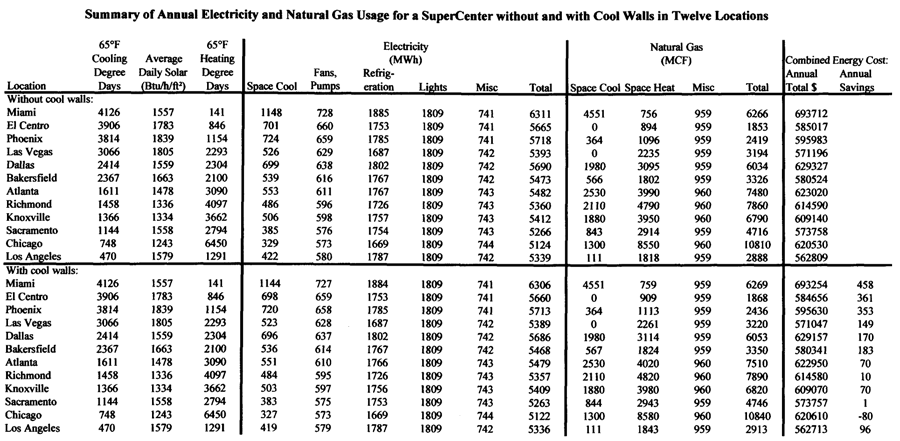
Reflective Roof (D4.14)
The roof on the store has a highly reflective white EPDM surface to save electricity for cooling. EPDM is used instead of PVC to reduce ozone impact from PVC manufacture. This membrane is manufactured from rubber and can be reused when it is no longer needed for this roof. The reference store also has a reflective roof, as Wal-Mart has been using white roofs for some time to reduce energy use in warmer climates. Since both the experimental store and reference store have reflective roofs, the relative energy savings are zero, but both stores save energy relative to a store without a reflective roof.
Advanced Entry Vestibules (D4.9)
The main entrance vestibules have daylighting and operable vent windows toward the top to allow excess heat to be vented. Vestibule louvers close when the outdoor air temperature drops below 55°F. Solar photovoltaic (PV) thin-film glazing is used for the roof, and the upper walls are translucent, fiberglass-type material. As shown here, the thin-film PV glazing in the roof shades direct sunlight while allowing daylight to filter into the space and offering a view to the outside. Air curtains were being tested to determine their effectiveness.
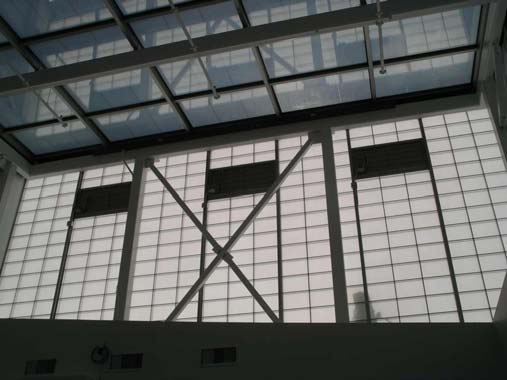
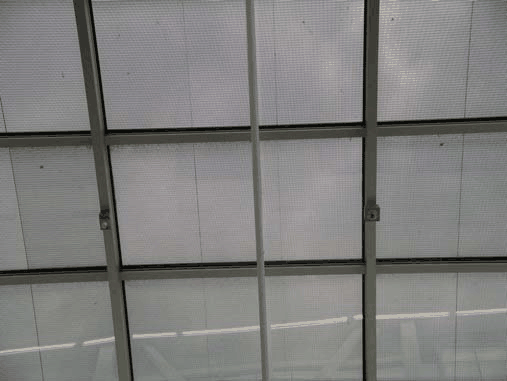
As mentioned previously, the vestibules also have radiantly heated floors.
The PV system results will be presented in a following section on PV systems.
The radiant floors keep the vestibules very comfortable in the winter. The reference store has gas-fired infrared heaters and an RTU to provide heat for the vestibules, and the reference store vestibules were often not as comfortable in the winter. Temperature rakes in the grocery vestibules of both stores provided hourly temperature data at several heights.
In the Summer, all the glazing in the experimental store vestibules allows them to become very hot. Initially there was no cooling, but cooling was added later, as the air curtains did not help much and were primarily an annoyance, blowing lots of air on people in two locations: at the outside entrance and as one entered the store proper. The air curtains were removed as part of the retrofits in 2009, and their removal contributed a small part to the savings presented in the “HVAC Electric Use Savings” section previously.
Clerestory
The front of the store faces the South, and a PV solar array there includes a signature “Blue Stripe” polycrystalline set of panels above and a second set of “building-integrated” vertical amorphous cell, thin-film glazing panels below, as seen in the picture here.
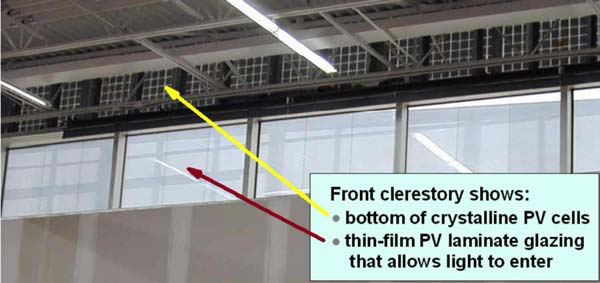
Performance results for the PV systems were shown as monthly summaries in Section 2 of this report and will also be discusses further in the “PV Systems” section later in this report.
The clerestory does provide a connection for associates and patrons to the outside at the front of the store that is noticeably different than typical supercenters.
Interior T5HO Lighting and Daylighting (D4.7)
Wal-Mart now uses daylighting with skylights in every supercenter. The experimental supercenter also has daylighting, but some additional light control zoning was added at the front of the store, due to the clerestory there. Use of daylighting in supercenters saves almost 20% of the lighting energy for those fixtures that are dimmed on the sales floor. Sales floor lighting energy in McKinney supercenters, not including perimeter lighting, is 640,000 kWh/yr, which is about 150,000 kWh/yr less than it would be without daylighting.
The lighting system in the sales area of this supercenter uses the smaller and optically superior T5HO (high output linear fluorescent) lamps. The sales floor lighting is provided by using 4-ft fixtures utilizing a single T5 fluorescent lamp in lieu of the standard fixtures found in similar Wal-Mart Supercenters that use T8 fluorescent lamps. One 54-Watt T5 lamp produces as much light as two 32-Watt T8 lamps. With fewer lamps, maintenance costs were expected to be reduced. Fewer lamps also means less mercury when lamps are disposed. ORNL did not evaluate maintenance cost savings.
Exterior Parking Lot Lighting (D4.6)
The parking lot lighting used High Performance Vertical (HPV) luminaires. The HPV luminaire is equipped with a dark-sky-friendly full cutoff optical system with a flat glass lens. This system maximizes visibility for users of the site and minimizes the glare and light trespass for neighbors. The HPV luminaires are equipped with 875-watt Pulse Start Metal Halide high output vertical lamps. These lamps provide 100,000 initial lumens and 80,000 mean lumens. These lamps provide superior lumen maintenance compared with 1000-watt systems, providing equal or greater light levels on the site over time.
While some potential energy savings is possible with these lighting systems, they still suffer from lack of dimming or quick shutoff-turn-on ability. Comparison of energy use for parking lots between sites is also difficult, since site layouts vary considerably. In McKinney there was little difference in parking lot lighting electricity use, with the reference store most often using less than the experimental store (Tables 4, 6, and 8). This situation resulted in part due to one set of lights outside the auto center at the reference store being left off on a regular basis. Regardless, Wal-Mart has been pursuing studies on LED (light-emitting-diode) parking lot lighting which have been successful and have indicated important potential energy and cost savings.
Produce lighting
The produce lighting was changed from the typical metal halide to lower total light hitting the produce. Small fixtures with small reflector lamps were used. Details on exact specification of the lamps were not obtained, but this type of lamp is often a halogen lamp, and LED versions are now available. Produce lighting is not separately metered, but electricity savings are in the range of 1,000 kWh/month, as compared to typical supercenter produce lighting. The produce lighting at this store is dim as a measure to increase produce life. Very limited informal input from store management about the effectiveness of this lighting varied over time. Feedback about the lighting being too dim was common, although the store manager did at one time indicate that customers had told him the produce at this store was “better” than at other stores, but subjective responses are all that are available. The height of the produce lighting was lowered to the ductsox elevation to reduce the wattages of the lamps.
Hybrid Solar Lighting System
The McKinney store also participated in the national field testing of Hybrid Solar Lighting (HSL) technology – a technology of collecting sunlight and distributing it, via optical fibers, into the interior of a building. The technology consisted of three main components:
- The tracking sunlight collector consists of a large parabolic primary mirror and a segmented secondary mirror designed to focus the visible portion of sunlight into a bundle of plastic optical fibers
- The optical fibers distribute light to a range of special fixtures
- The fixtures can vary, although at the McKinney store, the optical fiber ends were simply fixed along a lighting track and directed toward the merchandise racks to be illuminated.
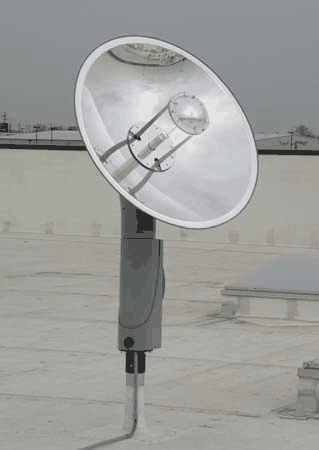
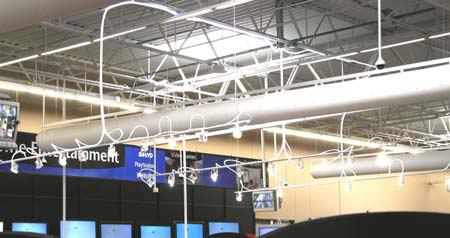
The HSL system was installed in late 2007. The optical fiber lighting was installed next to electric reflector lamp lighting in a small area of the electronics area of the store. The electric lighting was dimmed as sunlight delivered increased. The system was operated for several months, and the next figure provides some results of a comparison of the light dimming results obtained. In 2008, a system installed at another location melted the optical fiber bundle, which caused the system in McKinney to be shut down in May and June of 2008. The solution to the overheating that caused the melting was to defocus the primary reflector to 70%, which also reduced light delivered.
The figure here shows monthly savings values for the experimental store through August 2008. The system was down and not functioning in May and June 2008. Percentage values are calculated relative to the “daylight” portion of the average day for each month (e.g., July has a 14-hr daylit day).
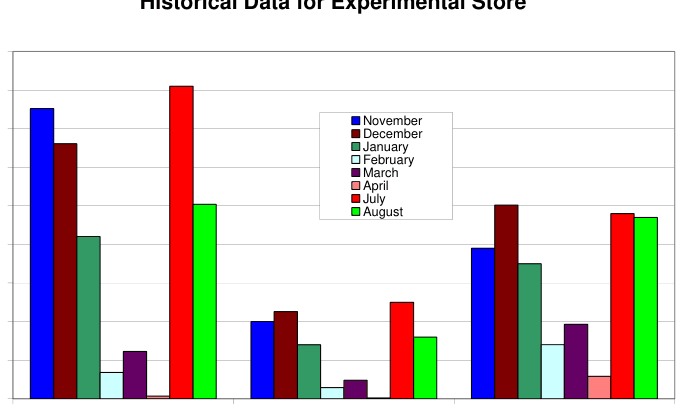
McKinney was a location of interest for testing HSL systems because it has occasional sustained heavy winds, and this test allowed wind durability of the HSL system to be tested. The test showed that the concentrating reflector was not able to remain focused in high wind conditions, which sometimes lasted for days in McKinney. A new tracker system was installed in July 2008, and results above for July show impressive performance. But deterioration was fairly quick, and by September 2008 the system was not working. By October 2008, the company that sold the HSL system was transitioning out of the HSL business, and this experiment was ended.
Light-emitting diode (LED) building signs
LED lighting is used for the building and monument signage in lieu of other less efficient lamp types. LED lights have a longer life span than fluorescent lights. Since LEDs improve the luminous uniformity and brightness of the signs, not only are they easier to read from further distances, but total light output required is less, which produces less heat and uses less energy.
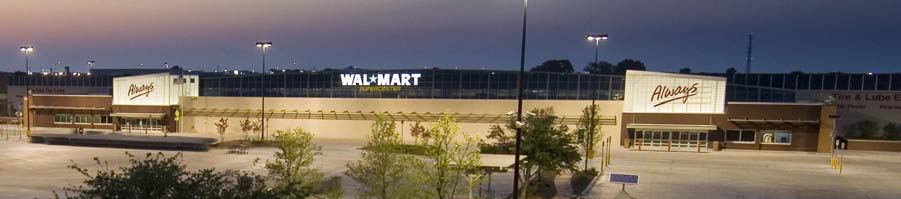
Solar for the large monument sign at the main entrance (D4.3)
The large monument sign for the store has a 1.6-kW solar PV system mounted in the parking lot at the far south entrance. This system provides electricity to help power the LED lighting of the sign. Theoretical annual electricity production of this array can be up to 2,500 kWh. This system supplies the electricity to light the sign at night, which meant that battery storage was required. An electric meter was installed that measured the energy delivered to the sign from the battery storage. About 640 kWh/yr is delivered to the sign by the battery system, an average of about 160 W over 4,000 hr/yr.
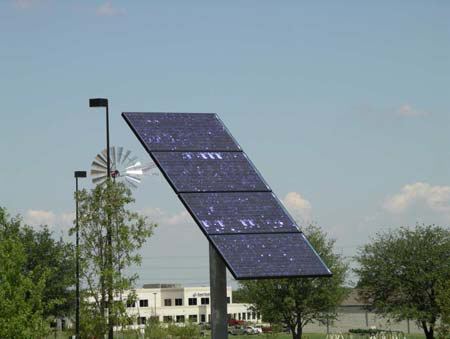
Wind power for the small monument sign at the side entrance (D4.3)
A small 1-kW wind turbine at the West side entrance of the site provides power to a battery storage system that feeds the LED monument sign there. The battery storage system delivers 250 kWh/yr to the small sign, an average of about 62 W over 4,000 hr/yr.
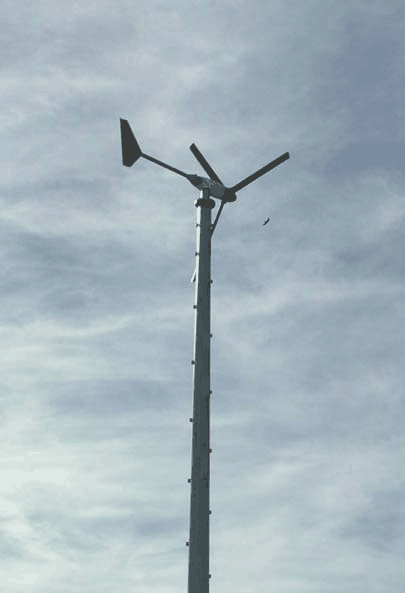
For both the monument sign systems, there were many components to the system that ORNL could not readily verify, and the complexity of the systems suggested that further development work in a laboratory setting might better allow efficient system designs to be finalized.
50-kW Wind Turbine (D4.2)
The 50-kW wind turbine at the center of the site, the Bergey XL 50, from Bergey Windpower Company, is the newest and most advanced small wind turbine on the market and Wal-Mart is the first company to install them for commercial use. The XL 50 has been designed for low average wind speed areas, where wind power has not been practical in the past. This model will operate in wind speeds as low as 4.5 mph and is rated at 50 kW at a wind speed of 11 meters/second (25 mph). The average wind speed in McKinney is approximately 10 mph. The turbine is mounted 120 feet high and has a 46 foot diameter rotor. The tail turns the device to face the wind and the backward tilt of the rotor provides storm protection in winds up to 120 mph.
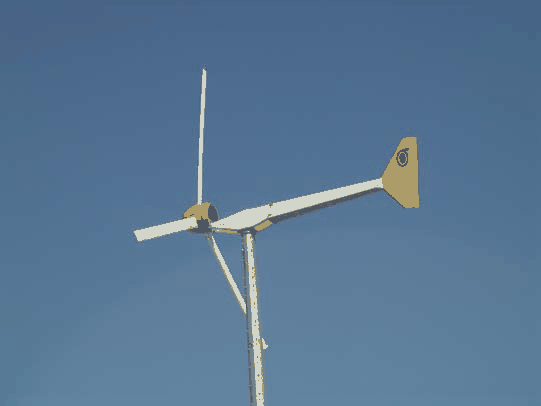
Wind is not constant, but steady power is needed for the Supercenter, so power processor electronics mounted at the base of the mounting tower convert the variable wind power into utility-grade electricity. The electrical output is then fed into the store’s main circuits, where it substitutes for power typically provided from the utility company. The higher the wind speed, the more power the turbine produces. System expectations were to generate about 80,000 kWhr/year. Actual production and approximate expectation based on average monthly wind speed are shown in the table here.
| Date | Experimental | Expectation |
|---|---|---|
| 10/19/2005 | 1,808 | 2,908 |
| 11/19/2005 | 205 | 4,176 |
| 12/19/2005 | 1,140 | 4,171 |
| 1/19/2006 | 0 | 8,182 |
| 2/19/2006 | 0 | 5,164 |
| 3/19/2006 | 5,280 | 8,219 |
| 4/19/2006 | 7,900 | 8,967 |
| 5/19/2006 | 2,010 | 5,886 |
| 6/19/2006 | 0 | 7,206 |
| 7/31/2006 | 2,930 | 6,846 |
| 8/31/2006 | 2465 | 4,657 |
| 9/30/2006 | 214 | 3,067 |
| 10/31/2006 | 0 | 3,907 |
| 11/30/2006 | 0 | 4,327 |
| 12/31/2006 | 0 | 4,387 |
| 1/31/2007 | 0 | 728 |
| 2/28/2007 | 3,854 | 5,856 |
| 3/31/2007 | 7,551 | 6,426 |
| 4/30/2007 | 4,025 | 5,796 |
| 5/31/2007 | 0 | 4,627 |
| 6/30/2007 | 0 | 5,676 |
| 7/31/2007 | 0 | 1,568 |
| 8/31/2007 | 0 | 3,697 |
| 9/30/2007 | 0 | 2,198 |
| 10/31/2007 | 0 | 2,558 |
| 11/30/2007 | 0 | 4,387 |
| 12/31/2007 | 0 | 3,967 |
| 1/31/2008 | 0 | 6,036 |
| 2/29/2008 | 0 | 6,726 |
| 3/31/2008 | 0 | 8,615 |
| 4/30/2008 | 0 | 9,185 |
| 5/31/2008 | 4,875 | 7,206 |
| 6/30/2008 | 3,863 | 10,055 |
| 7/31/2008 | 7,520 | 6,126 |
| 8/31/2008 | 4,693 | 3,397 |
| 9/30/2008 | 4,762 | 1,058 |
| 10/31/2008 | 3,359 | 3,097 |
| 11/30/2008 | 3,668 | 3,637 |
| 12/31/2008 | 1,954 | 6,396 |
| TOTAL | 74,075 | 201,092 |
As can be seen from the table on the previous page, the experimental wind turbine produced a little less than 40% of expected output over the three years. This turbine model was not fully developed, and the one installed at McKinney was the first of its kind. Within the first six months, failures dropped total production to only about 35% of expectations. The turbine “stow” position for high winds involves the rotor housing tipping up to bring the blades to a horizontal position, with neutral wind force on the blades. In November 2005, the turbine failed to completely stow in very high winds, which caused major fixes to be needed. This situation led to a new design, and a new turbine was installed. In late 2006, the inverter (power electronics) had some type of failure and had to be replaced, which stopped power production for over four months. After the inverter was fixed, after less than four months, another inverter-related problem started that kept power from being delivered to the store for over a year. The system then worked for seven months, after which another failure of some type in the last month of the three-year period (Dec-08) caused power production to stop again. Availability was not high.
Photovoltaic (PV) Systems
There are several PV systems installed at the experimental store: as the roof of each entry vestibule (mostly transparent glazing, almost horizontal), on the front of the store (vertical, mixed opaque and semi-transparent), on the roof of the auto center (opaque rubber roof segments, horizontal), and on the slanted roof of the garden center (partially translucent, slant). The garden center array has a striking appearance when viewed from some angles, as the photo here indicates.
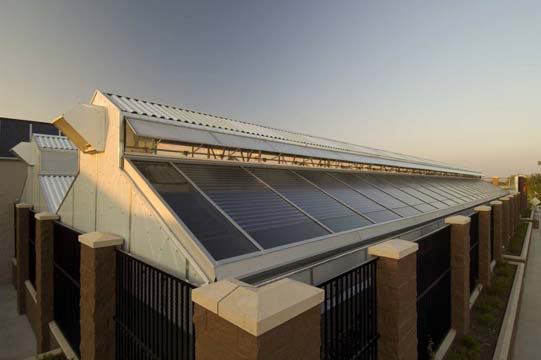
The PV systems were given array names, which are shown in the next list for reference.
Naming of PV Arrays and Location
- PV1&2, vestibule roof arrays
- PV3, Auto Center (TLE) Roof
- PV4, Garden Center roof
- PV5, vertical polycrystalline at the clerestory, Blue Stripe
- PV5, vertical clerestory thin-film glazing
Further descriptions of the PV modules, taken from the O&M manual, as well as expected performance, are given in the table below. EDC means electrical distribution center, of which the store has four.
| ID | Location | Peak DC Power | Expected Annual kWh | Modules | Inverters |
|---|---|---|---|---|---|
| Entry Vestibules PV1 & 2 | Roof glazing, amorphous | 6.8 kW | 8,350 kWh | 90 RWE Schott AsiThru 3-IO 75W | 4 SMA 2500 in EDC 2 |
| Roof thin-film rubber laminate PV3 | Part of auto center roof | 4.6 kW | 5,700 kWh | 6 Sarnafil 768W | 3 SMA 1800 in EDC 3 |
| Polycrystalline laminates PV4 | Garden Center sloped roof | 11.0 kW | 14,600 kWh | 44 RWE Schott SkyView 250W | 5 SMA 2500 in EDC 2 |
| Curtain Wall polycrystalline PV5 | Front clerestory and above | 31.5 kW | 23,500 kWh | 119 RWE Schott 265W | 15 SMA 2500 in EDC 4 |
| Curtain Wall amorphous glazing PV5 | Front clerestory | 2.95 kW | 2,400 kWh | 39 RWE Schott AsiThru 3-IO 75W | 2 SMA 1800 in EDC 4 |
The expected performance values for kWh produced can be used with the design kW to calculate annualized power production percentage (based on 8,760 hr) = kWh x 100 / (kW x 8760). For fixed position south-facing arrays, the best percentage will be for sloped elevation approximately the latitude value, in degrees, above horizontal. For the latitude of the McKinney store (33˚N), horizontal placement would be expected to perform better than vertical. The expected performance values above lead to the annualized expected production percentages shown in the table below.
| Location | Array | Position | Production (%) |
|---|---|---|---|
| Entry Vestibules | PV1 & 2 | horizontal | 14.02% |
| Part of auto center roof | PV3 | horizontal | 14.15% |
| Garden Center sloped roof | PV4 | sloped | 15.15% |
| Front clerestory | PV5 crystalline | vertical | 8.52% |
| Front clerestory wall glazing | PV5 thin-film | vertical | 9.29% |
The reported inverter “nominal” wiring configurations for each array are given in the table to the right. The PV5 array included both the crystalline and thin-film glazing array outputs combined in EDC4, with the AC output fed to a combiner panel in EDC1. The AC inverter output from all arrays is sent to this combiner panel and then fed to a local 208V panel. PV array power production was measured as the amount of energy delivered to the local 208V panel (L1D) in EDC1.
| PV Array | AC Power Configuration |
|---|---|
| PV1&2 arrays | 240V, 3ph, Delta |
| PV3 array | 208V, 3ph, Wye |
| PV4 array | 240V, 3ph, Delta |
| PV5 array | 208V, 3ph, Wye |
PV Arrays 1&2 Results (part of D4.5)
PV Arrays 1 and 2 form the roofs of the two front entrance vestibules for the experimental store. The photo here shows the roof and the top of one of the vestibules from the outside. The translucent siding and the vent louvers are also seen.
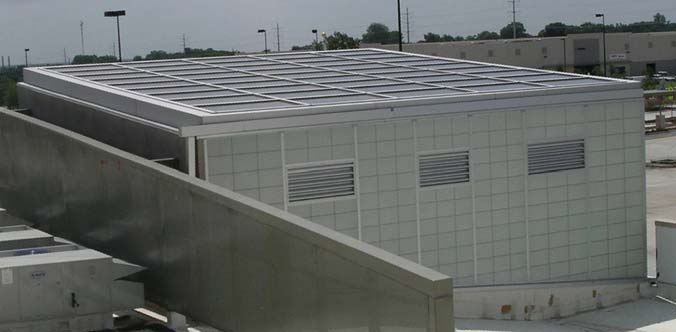
Design expectations were to generate 8,350 kWh/year. Actual production and approximate expectation based on a simple sinusoid curve are shown in the table on the next page. The average annual production over the three years was 7,680 kWh/yr, or 92% of expectations.
Production was impacted negatively in the second and third years, apparently by dirt or mildew buildup on the roofs of the vestibules. The roofs were much cleaner beginning in August or September 2008. In this table, the expectation values were calculated with a simple sinusoidal function based on the design expectation, and the production total here is 94% of the expectation total.
| Date | Production | Expectation |
|---|---|---|
| 10/19/2005 | 280 | 435 |
| 11/19/2005 | 280 | 318 |
| 12/19/2005 | 350 | 303 |
| 1/19/2006 | 344 | 393 |
| 2/19/2006 | 613 | 564 |
| 3/19/2006 | 756 | 770 |
| 4/19/2006 | 1,048 | 957 |
| 5/19/2006 | 1,218 | 1,073 |
| 6/19/2006 | 1,189 | 1,089 |
| 7/31/2006 | 1,129 | 999 |
| 8/31/2006 | 898 | 828 |
| 9/30/2006 | 616 | 622 |
| 10/31/2006 | 437 | 435 |
| 11/30/2006 | 515 | 318 |
| 12/31/2006 | 682 | 303 |
| 1/31/2007 | 526 | 393 |
| 2/28/2007 | 477 | 564 |
| 3/31/2007 | 659 | 770 |
| 4/30/2007 | 502 | 957 |
| 5/31/2007 | 576 | 1,073 |
| 6/30/2007 | 723 | 1,089 |
| 7/31/2007 | 914 | 999 |
| 8/31/2007 | 1,028 | 828 |
| 9/30/2007 | 694 | 622 |
| 10/31/2007 | 437 | 435 |
| 11/30/2007 | 457 | 318 |
| 12/31/2007 | 514 | 303 |
| 1/31/2008 | 519 | 393 |
| 2/29/2008 | 588 | 564 |
| 3/31/2008 | 654 | 770 |
| 4/30/2008 | 712 | 957 |
| 5/31/2008 | 689 | 1,073 |
| 6/30/2008 | 515 | 1,089 |
| 7/31/2008 | 406 | 999 |
| 8/31/2008 | 978 | 828 |
| 9/30/2008 | 578 | 622 |
| 10/31/2008 | 445 | 435 |
| 11/30/2008 | 280 | 435 |
| 12/31/2008 | 280 | 318 |
| TOTAL | 23,946 | 25,491 |
PV Array 3 Results (D4.4)
PV Array 3 consists of modules on a rubber roof segment that is sealed to the roof membrane. The roof membrane at the experimental store is EPDM rubber. Design expectations were to generate 5,700 kWh/year. The output of this array was low throughout the three year period, so a technician came and checked the roof module output and verified that the modules were producing as expected. Similar checks on inverter output were not made, and one possible cause of the low measured power delivered to the 208V panel in EDC1 is that the inverters were not set to make sure all the power was delivered through the combiner panel. Measured production and approximate expectation based on a simple sinusoid curve are shown in the “Array 3” table on the next page. The average annual production over the three years was 2,464 kWh/yr, or 43% of expectations. In the “Array 3” table, the expectation values were calculated with a simple sinusoidal function based on the design expectation, and the production total in the table is 44% of the expectation total. A photo of the modules is shown below.
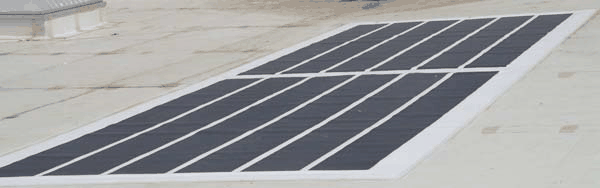
| Date | Production | Expectation |
|---|---|---|
| 10/19/2005 | 170 | 296 |
| 11/19/2005 | 180 | 275 |
| 12/19/2005 | 220 | 309 |
| 1/19/2006 | 207 | 386 |
| 2/19/2006 | 364 | 488 |
| 3/19/2006 | 390 | 586 |
| 4/19/2006 | 465 | 654 |
| 5/19/2006 | 371 | 675 |
| 6/19/2006 | 207 | 642 |
| 7/31/2006 | 170 | 564 |
| 8/31/2006 | 144 | 463 |
| 9/30/2006 | 101 | 364 |
| 10/31/2006 | 85 | 296 |
| 11/30/2006 | 75 | 275 |
| 12/31/2006 | 97 | 309 |
| 1/31/2007 | 129 | 386 |
| 2/28/2007 | 153 | 488 |
| 3/31/2007 | 163 | 586 |
| 4/30/2007 | 169 | 654 |
| 5/31/2007 | 183 | 675 |
| 6/30/2007 | 204 | 642 |
| 7/31/2007 | 158 | 564 |
| 8/31/2007 | 192 | 463 |
| 9/30/2007 | 133 | 364 |
| 10/31/2007 | 103 | 296 |
| 11/30/2007 | 145 | 275 |
| 12/31/2007 | 177 | 309 |
| 1/31/2008 | 205 | 386 |
| 2/29/2008 | 279 | 488 |
| 3/31/2008 | 305 | 586 |
| 4/30/2008 | 348 | 654 |
| 5/31/2008 | 358 | 675 |
| 6/30/2008 | 289 | 642 |
| 7/31/2008 | 251 | 564 |
| 8/31/2008 | 218 | 463 |
| 9/30/2008 | 157 | 364 |
| 10/31/2008 | 118 | 296 |
| 11/30/2008 | 170 | 296 |
| 12/31/2008 | 180 | 275 |
| TOTAL | 7,683 | 17,400 |
PV Array 4 Results (part of D4.5)
PV Array 4 forms part of the garden center roof as seen in the previous photo. Design expectations were to generate 14,600 kWh/year. Measured results were impacted both by faulty electric meter wiring on our part for the first year and by major condensation events inside the module glazing the second and third years during the peak summer production period. The average annual production over the two years with valid production data was 12,072 kWh/yr, or 83% of expectations. In the “Array 4” table here, the expectation values were calculated with a simple sinusoidal function based on the design expectation, and the production total in the table is 83% of the expectation total.
| Date | Production | Expectation |
|---|---|---|
| 10/19/2005 | 130 | 1,192 |
| 11/19/2005 | 110 | 995 |
| 12/19/2005 | 140 | 859 |
| 1/19/2006 | 160 | 818 |
| 2/19/2006 | 160 | 884 |
| 3/19/2006 | 91 | 1,039 |
| 4/19/2006 | 61 | 1,242 |
| 5/19/2006 | 61 | 1,438 |
| 6/19/2006 | 20 | 1,575 |
| 7/31/2006 | 232 | 1,616 |
| 8/31/2006 | 950 | 1,550 |
| 9/30/2006 | 650 | 1,395 |
| 10/31/2006 | 857 | 1,192 |
| 11/30/2006 | 798 | 995 |
| 12/31/2006 | 809 | 859 |
| 1/31/2007 | 805 | 818 |
| 2/28/2007 | 935 | 884 |
| 3/31/2007 | 1,016 | 1,039 |
| 4/30/2007 | 1,019 | 1,242 |
| 5/31/2007 | 1,378 | 1,438 |
| 6/30/2007 | 690 | 1,575 |
| 7/31/2007 | 641 | 1,616 |
| 8/31/2007 | 649 | 1,550 |
| 9/30/2007 | 1,171 | 1,395 |
| 10/31/2007 | 1,531 | 1,192 |
| 11/30/2007 | 1,075 | 995 |
| 12/31/2007 | 950 | 859 |
| 1/31/2008 | 978 | 818 |
| 2/29/2008 | 1,095 | 884 |
| 3/31/2008 | 1,107 | 1,039 |
| 4/30/2008 | 1,231 | 1,242 |
| 5/31/2008 | 1,363 | 1,438 |
| 6/30/2008 | 780 | 1,575 |
| 7/31/2008 | 374 | 1,616 |
| 8/31/2008 | 861 | 1,550 |
| 9/30/2008 | 1,246 | 1,395 |
| 10/31/2008 | 1,227 | 1,192 |
| 11/30/2008 | 1,135 | 995 |
| 12/31/2008 | 920 | 859 |
| 2-yr TOTAL | 24,177 | 29,205 |
PV Array 5 Results (part of D4.5)
PV Array 5 forms a curtain wall for the top part of the front clerestory and consists of two sets of modules listed previously: a top set of polycrystalline modules that also extend above the roof line and form the signature blue stripe for the store, and a lower set of glazing modules. The blue stripe also extends beyond the clerestory glazing modules, as seen in the photo here.
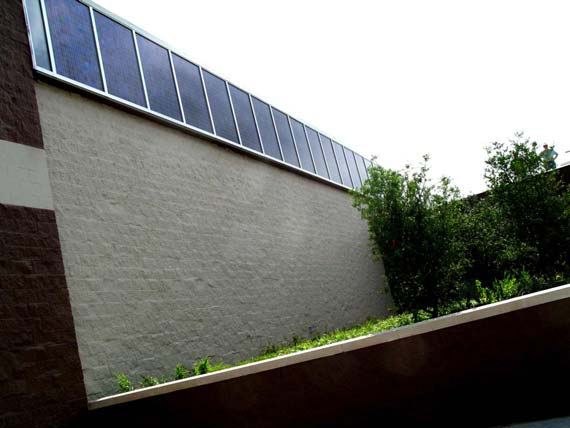
Design expectations for both sets of modules combined were to generate 25,900 kWh/year. The average annual production over the three years was 24,800 kWh/yr, or 96% of expected. In the “Array 5” table here, the expectation values were calculated with a simple sinusoidal function based on the design expectation, and the production total in the table is 97% of the expectation total. The production value for the period ending 12-31-07 is estimated but expected to be close to actual.
| Date | Production | Expectation |
|---|---|---|
| 10/19/2005 | 2,399 | 2,654 |
| 11/19/2005 | 2,316 | 2,347 |
| 12/19/2005 | 1,740 | 1,852 |
| 1/19/2006 | 1,572 | 1,663 |
| 2/19/2006 | 1,512 | 1,972 |
| 3/19/2006 | 1,860 | 2,467 |
| 4/19/2006 | 2,471 | 2,653 |
| 5/19/2006 | 2,323 | 2,346 |
| 6/19/2006 | 2,134 | 1,851 |
| 7/31/2006 | 2,010 | 1,663 |
| 8/31/2006 | 2,102 | 1,970 |
| 9/30/2006 | 2,304 | 2,465 |
| 10/31/2006 | 2120 | 2,654 |
| 11/30/2006 | 1,754 | 2,347 |
| 12/31/2006 | 1,511 | 1,852 |
| 1/31/2007 | 1,700 | 1,663 |
| 2/28/2007 | 1,875 | 1,972 |
| 3/31/2007 | 2,180 | 2,467 |
| 4/30/2007 | 2,346 | 2,653 |
| 5/31/2007 | 2,343 | 2,346 |
| 6/30/2007 | 1,597 | 1,851 |
| 7/31/2007 | 1,622 | 1,663 |
| 8/31/2007 | 1,764 | 1,970 |
| 9/30/2007 | 1,927 | 2,465 |
| 10/31/2007 | 2,056 | 2,654 |
| 11/30/2007 | 2,704 | 2,347 |
| 12/31/2007 | 2,142 | 1,852 |
| 1/31/2008 | 1,923 | 1,663 |
| 2/29/2008 | 1,980 | 1,972 |
| 3/31/2008 | 2,473 | 2,467 |
| 4/30/2008 | 2,407 | 2,653 |
| 5/31/2008 | 2,508 | 2,346 |
| 6/30/2008 | 1,960 | 1,851 |
| 7/31/2008 | 2,114 | 1,663 |
| 8/31/2008 | 2,184 | 1,970 |
| 9/30/2008 | 1,921 | 2,465 |
| 10/31/2008 | 1,927 | 2,654 |
| 11/30/2008 | 2,366 | 2,347 |
| 12/31/2008 | 2,143 | 1,852 |
| TOTAL | 83,503 | 86,223 |
Other Experiments
Several additional experiments were conducted at the McKinney experimental supercenter that were not covered as part of the work scope of this technical evaluation. Some of these experiments have been mentioned briefly in this report as part of the reporting on related features or experiments that were covered here. One example of another experiment is an extensive waste oil system that was tested. Waste oil from deli cooking operations, and from used motor oil in the auto center, was delivered to the mechanical room, where a waste oil boiler was installed. Waste disposal costs were a driver in testing these items, but during the course of the experiment waste oil became oil that could be recycled, and the potential benefit for burning waste oil to generate heat for use in the store went away. The waste oil system was mostly removed as part of the retrofits to the store in 2009.
Conclusion
Evaluation of new technology and sustainability improvements was the goal of the work reported here. Wal-Mart continues to look to improve the sustainability of their properties. The technical evaluation results presented here cover the McKinney experimental supercenter over a three-year monitoring period of 2006–2008, and also some results between the store Grand Opening on July 19, 2005, and December 31, 2005. In addition, some limited results have been presented on energy results for retrofits installed in the experimental supercenter in 2009.
While evaluation results are mixed, Wal-Mart gained:
- Knowledge of how to achieve sustainability improvements,
- Experience with the design, design process, and operations for some specific advanced technologies,
- An increased understanding of energy use patterns in their stores,
- A more solid foundation for achieving major carbon footprint reductions, and
- Measurement of the potential benefits of specific technologies tested.
This report concludes the technical evaluation effort for third-party monitoring of experiments at the McKinney experimental supercenter and provides results or information on results for all technologies of import for the energy-focused portion of the evaluation.
Appendix IC — Instrumentation and Cabling
Monitoring instrumentation cable and device listing — McKinney Store 206
Cable numbers are prefixed 0206-01. A quotation mark (") in a cell repeats the entry in the row above.
Data Logger 1
| Cable number (Note 5) | Starting point | Termination point | 2-wire shielded cable, estimated run length (ft) (Notes 1 & 4) | 4-wire shielded cable, estimated run length (ft) (Notes 2 & 4) | Type T thermocouple extension cable, estimated run length (ft) (Notes 3 & 4) | Installation comments |
|---|---|---|---|---|---|---|
| DL1-1 | EDC1, meter EM1 | data logger 1 located in UPS room below terminus of cable tray segment E (see DWG E2 markup) | 130.00 | run cable from EDC 1 to logger 1 along cable tray segments D, C, & E (see DWG E2 markup) to terminus of segment E in UPS room | ||
| DL1-2 | EDC1, meter EM2 | " | 130.00 | " | ||
| DL1-3 | EDC1, meter EM3 | " | 130.00 | " | ||
| DL1-4 | EDC1, meter EM4 | " | 130.00 | " | ||
| DL1-5 | EDC1, meter EM5 | " | 130.00 | " | ||
| DL1-6 | EDC1, meter EM6 | " | 130.00 | " | ||
| DL1-7 | EDC1, meter EM10 | " | 130.00 | " | ||
| DL1-8 | EDC1, meter EM12 | " | 130.00 | " | ||
| DL1-9 | EDC1, meter EM15 | " | 130.00 | " | ||
| DL1-10 | EDC1, meter EM18 | " | 130.00 | " | ||
| DL1-11 | EDC1, meter EM19 | " | 130.00 | " | ||
| DL1-12 | EDC1, meter EM20 | " | 130.00 | " | ||
| DL1-13 | EDC1, meter EM21 | " | 130.00 | " | ||
| DL1-14 | EDC1, meter EM29 | " | 130.00 | " | ||
| DL1-15 | TLE mech room, FM1 | " | 440.00 | run cable from terminus of cable tray segment A along cable tray segments A, B, C, & E (see DWG E2 markup) to terminus of segment E in UPS room | ||
| DL1-16 | TLE mech room, FM1 Hot water supply temp | " | 440.00 | " | ||
| DL1-17 | TLE mech room, FM1 Hot water return temp | " | 440.00 | " | ||
| DL1-18 | TLE mech room, FM2 | " | 440.00 | " | ||
| DL1-19 | TLE mech room, FM2 Hot water supply temp | " | 440.00 | " | ||
| DL1-20 | TLE mech room, FM2 Hot water return temp | " | 440.00 | " | ||
| DL1-21 | TLE mech room, FM3 | " | 440.00 | " | ||
| DL1-22 | TLE mech room, FM3 Hot water supply temp | " | 440.00 | " | ||
| DL1-23 | TLE mech room, FM3 Hot water return temp | " | 440.00 | " | ||
| DL1-24 | TLE mech room, FM4 | " | 440.00 | " | ||
| DL1-25 | TLE mech room, FM4 Hot water supply temp | " | 440.00 | " | ||
| DL1-26 | TLE mech room, FM4 Hot water return temp | " | 440.00 | " | ||
| DL1-27 | appx grid F.4/1.5, FM5 | " | 285.00 | run cable in conduit from meter location to cable tray segment G, then along cable tray segments G, F, and E (see DWG E2 markup) to terminus of segment E in UPS room | ||
| DL1-28 | appx grid F.4/1.5, FM5 Hot water supply temp | " | 285.00 | " | ||
| DL1-29 | appx grid F.4/1.5, FM5 Hot water return temp | " | 285.00 | " | ||
| DL1-30 | appx grid G.1/14, FM15 | " | 500.00 | run cable in conduit from meter location to cable tray segment A, then along cable tray segments A, B, C, and E (see DWG E2 markup) to terminus of segment E in UPS room | ||
| DL1-31 | appx grid G.1/14, FM15 Hot water supply temp | " | 500.00 | " | ||
| DL1-32 | appx grid G.1/14, FM15 Hot water return temp | " | 500.00 | " | ||
| DL1-33 | appx grid G.1/14, FM16 | " | 500.00 | " | ||
| DL1-34 | appx grid G.1/14, FM16 Hot water supply temp | " | 500.00 | " | ||
| DL1-35 | appx grid G.1/14, FM16 Hot water return temp | " | 500.00 | " | ||
| DL1-36 | appx grid F/1.5, FM17 | " | 300.00 | run cable in conduit from meter location to cable tray segment G, then along cable tray segments G, F, and E (see DWG E2 markup) to terminus of segment E in UPS room | ||
| DL1-37 | appx grid F/1.5, FM17 Hot water supply temp | " | 300.00 | " | ||
| DL1-38 | appx grid F/1.5, FM17 Hot water return temp | " | 300.00 | " | ||
| DL1-39 | appx grid D.5/2.4, RH sensor for station TH-4 | " | 340.00 | run cable in conduit from meter location to cable tray segment G, then along cable tray segments G, F, and E (see DWG E2 markup) to terminus of segment E in UPS room | ||
| DL1-40 | appx grid H/4, RH sensor for station TH-5 | " | 120.00 | run cable in conduit from meter location to cable tray segment F, then along cable tray segments F and E (see DWG E2 markup) to terminus of segment E in UPS room | ||
| DL1-41 | appx grid F/4, RH sensor for station TH-6 | " | 220.00 | run cable in conduit from meter location to cable tray segment G, then along cable tray segments G, F, and E (see DWG E2 markup) to terminus of segment E above UPS room | ||
| DL1-42 | appx grid E.8/7.5, general sales area light meter | " | 275.00 | run cable in conduit from meter location to cable tray segment B, then along cable tray segments B, C, and E (see DWG E2 markup) to terminus of segment E above UPS room | ||
| DL1-43 | appx grid D.5/2.4, temp sensor 1 for station TH-4 | " | 300.00 | run cable in conduit from meter location to cable tray segment G, then along cable tray segments G, F, and E (see DWG E2 markup) to terminus of segment E in UPS room | ||
| DL1-44 | appx grid D.5/2.4, temp sensor 2 for station TH-4 | " | 300.00 | " | ||
| DL1-45 | appx grid D.5/2.4, temp sensor 3 for station TH-4 | " | 300.00 | " | ||
| DL1-46 | appx grid D.5/2.4, temp sensor 4 for station TH-4 | " | 300.00 | " | ||
| DL1-47 | appx grid D.5/2.4, temp sensor 5 for station TH-4 | " | 300.00 | " | ||
| DL1-48 | appx grid H/4, temp sensor 1 for station TH-5 | " | 120.00 | run cable in conduit from meter location to cable tray segment F, then along cable tray segments F and E (see DWG E2 markup) to terminus of segment E in UPS room | ||
| DL1-49 | appx grid H/4, temp sensor 2 for station TH-5 | " | 120.00 | " | ||
| DL1-50 | appx grid H/4, temp sensor 3 for station TH-5 | " | 120.00 | " | ||
| DL1-51 | appx grid H/4, temp sensor 4 for station TH-5 | " | 120.00 | " | ||
| DL1-52 | appx grid H/4, temp sensor 5 for station TH-5 | " | 120.00 | " | ||
| DL1-53 | appx grid F/4, temp sensor 1 for station TH-6 | " | 220.00 | run cable in conduit from meter location to cable tray segment G, then along cable tray segments G, F, and E (see DWG E2 markup) to | ||
| DL1-54 | appx grid F/4, temp sensor 2 for station TH-6 | " | 220.00 | " | ||
| DL1-55 | appx grid F/4, temp sensor 3 for station TH-6 | " | 220.00 | " | ||
| DL1-56 | appx grid F/4, temp sensor 4 for station TH-6 | " | 220.00 | " | ||
| DL1-57 | appx grid F/4, temp sensor 5 for station TH-6 | " | 220.00 | " | ||
| DL1-58 | weather station, wind speed | " | cable to be ordered to length with weather station | |||
| DL1-59 | weather station, wind direction | " | " | |||
| DL1-60 | weather station, air temperature | " | " | |||
| DL1-61 | weather station, dew point temperature (or RH) | " | " | |||
| DL1-62 | weather station, rain gauge | " | " | |||
| DL1-63 | weather station, solar radiation horizontal | " | " | |||
| DL1-64 | weather station, solar radiation vertical south | " | " | |||
| DL1-65 | weather station, barometric pressure | " | " | |||
| DL1-66 | weather station, light meter | " | " | |||
| DL1-67 | total gas meter (NOTE 7) | " | 450.00 | run cable in conduit from gas meter to cable tray segment A, then along cable tray segments A, B, C, & E (see DWG E2 markup) to terminus of segment E in UPS room | ||
| DL1-68 | EDC3, meter EM39 | " | 460.00 | run cable in conduit from EDC3 to cable tray segment A, then along cable tray segments A, B, C, & E (see DWG E2 markup) to terminus of segment E in UPS room | ||
| DL1-69 | EDC3, meter EM40 | " | 460.00 | " | ||
| DL1-70 | EDC3, meter EM41 | " | 460.00 | " | ||
| DL1-71 | EDC3, meter EM42 | " | 460.00 | " | ||
| DL2-1 | EDC2, meter EM7 | data logger 2 located in LP office below terminus of cable tray segment K (see DWG E2 markup) | 330 | run cable from EDC 2 to logger 2 along cable tray segments N, M, & K (see DWG E2 markup) to terminus of segment K in LP office | ||
| DL2-2 | EDC2, meter EM9 | " | 330 | " | ||
| DL2-3 | EDC2, meter EM13 | " | 330 | " | ||
| DL2-4 | EDC2, meter EM14 | " | 330 | " | ||
| DL2-5 | EDC2, meter EM16 | " | 330 | " | ||
| total estimated cable run length | 7455.00 | 7645.00 | 3200.00 | |||
| total excess per NOTE 4 | 1350.00 | 1000.00 | 750.00 | |||
| total estimated cable required (ft) | 8805.00 | 8645.00 | 3950.00 |
Notes:
- Cable shall have one shielded pair of AWG 20 or larger with ground wire
- Cable shall have two shielded pairs of AWG 20 or larger with ground wire
- Shall be Omega type EXPP-T-20 or equal
- Please leave at least 25 ft of excess at both ends of each cable for ORNL use in making final connections to instruments and data logger
- Please clearly label cables at each end with cable number
- Where conduit is used to carry cables to nearest cable tray, make sure conduit is securely attached to ceiling structural members and/or wall and is of a color that will blend in with surroundings. Conduit may be rigid or flexible type and may be of metal or PVC material.
- Re DL1-67: The plan is to work with the gas utility to get a pulse output added to the utility meter, run the signal wire into the TLE mech room (hopefully through an existing penetration), and connect that to the extension cable coming from cable tray A
terminus of segment E in UPS room
Data Logger 2
| Cable number (Note 5) | Starting point | Termination point | 2-wire shielded cable, estimated run length (ft) (Notes 1 & 4) | 4-wire shielded cable, estimated run length (ft) (Notes 2 & 4) | Type T thermocouple extension cable, estimated run length (ft) (Notes 3 & 4) | Installation comments |
|---|---|---|---|---|---|---|
| DL2-1 | EDC2, meter EM7 | data logger 2 located in LP office below terminus of cable tray segment K (see DWG E2 markup) | 330 | run cable from EDC 2 to logger 2 along cable tray segments N, M, & K (see DWG E2 markup) to terminus of segment K in LP office | ||
| DL2-2 | EDC2, meter EM9 | " | 330 | " | ||
| DL2-3 | EDC2, meter EM13 | " | 330 | " | ||
| DL2-4 | EDC2, meter EM14 | " | 330 | " | ||
| DL2-5 | EDC2, meter EM16 | " | 330 | " | ||
| DL2-6 | EDC2, meter EM22 | " | 330 | " | ||
| DL2-7 | EDC2, meter EM23 | " | 330 | " | ||
| DL2-8 | EDC2, meter EM26 | " | 330 | " | ||
| DL2-9 | EDC2, meter EM27 | " | 330 | " | ||
| DL2-10 | EDC2, meter EM30 | " | 330 | " | ||
| DL2-11 | EDC4, meter EM8 | " | 300 | run cable from EDC 4 to logger 2 along cable tray segments H, I, L, & K (see DWG E2 markup) to terminus of segment K in LP office | ||
| DL2-12 | EDC4, meter EM11 | " | 300 | " | ||
| DL2-13 | EDC4, meter EM17 | " | 300 | " | ||
| DL2-14 | EDC4, meter EM24 | " | 300 | " | ||
| DL2-15 | EDC4, meter EM25 | " | 300 | " | ||
| DL2-16 | EDC4, meter EM28 | " | 300 | " | ||
| DL2-17 | EDC4, meter EM31 | " | 300 | " | ||
| DL2-18 | EDC4, meter EM32 | " | 300 | " | ||
| DL2-19 | EDC4, meter EM33 | " | 300 | " | ||
| DL2-20 | EDC4, meter EM34 | " | 300 | " | ||
| DL2-21 | EDC4, meter EM35 | " | 300 | " | ||
| DL2-22 | EDC4, meter EM36 | " | 300 | " | ||
| DL2-23 | EDC4, meter EM37 | " | 300 | " | ||
| DL2-24 | EDC4, meter EM38 | " | 300 | " | ||
| DL2-25 | appx grid B.2/6.6, FM6 | " | 200 | run cable in conduit from meter location to cable tray segment M, then along cable tray segments M and K (see DWG E2 markup) to terminus of segment K in LP office | ||
| DL2-26 | appx grid B.2/6.6, FM6 Hot water supply temp | " | 200 | " | ||
| DL2-27 | appx grid B.2/6.6, FM6 Hot water return temp | " | 200 | " | ||
| DL2-28 | appx grid D/8.5, FM7 | " | 375 | " | ||
| DL2-29 | appx grid D/8.5, FM7 Hot water supply temp | " | 375 | " | ||
| DL2-30 | appx grid D/8.5, FM7 Hot water return temp | " | 375 | " | ||
| DL2-31 | appx grid B.6/8.9, FM8 | " | 300 | " | ||
| DL2-32 | appx grid B.6/8.9, FM8 Hot water supply temp | " | 300 | " | ||
| DL2-33 | appx grid B.6/8.9, FM8 Hot water return temp | " | 300 | " | ||
| DL2-34 | appx grid A.8/4.6, FM10 | " | 75 | " | ||
| DL2-35 | appx grid A.8/4.6, FM10 Hot water supply temp | " | 75 | " | ||
| DL2-36 | appx grid A.8/4.6, FM10 Hot water return temp | " | 75 | " | ||
| DL2-37 | appx grid A.8/5.3, FM11 | " | 120 | " | ||
| DL2-38 | appx grid A.8/5.3, FM11 Hot water supply temp | " | 120 | " | ||
| DL2-39 | appx grid A.8/5.3, FM11 Hot water return temp | " | 120 | " | ||
| DL2-40 | appx grid A.8/6.9, FM12 | " | 200 | " | ||
| DL2-41 | appx grid A.8/6.9, FM12 Hot water supply temp | " | 200 | " | ||
| DL2-42 | appx grid A.8/6.9, FM12 Hot water return temp | " | 200 | " | ||
| DL2-43 | appx grid A.8/7.1, FM13 | " | 210 | " | ||
| DL2-44 | appx grid A.8/7.1, FM13 Hot water supply temp | " | 210 | " | ||
| DL2-45 | appx grid A.8/7.1, FM13 Hot water return temp | " | 210 | " | ||
| DL2-46 | appx grid A.8/8.6, FM14 | " | 275 | " | ||
| DL2-47 | appx grid A.8/8.6, FM14 Hot water supply temp | " | 275 | " | ||
| DL2-48 | appx grid A.8/8.6, FM14 Hot water return temp | " | 275 | " | ||
| DL2-49 | appx grid A.8/8.8, FM19 | " | 290 | " | ||
| DL2-50 | appx grid A.8/8.8, FM19 Hot water supply temp | " | 290 | " | ||
| DL2-51 | appx grid A.8/8.8, FM19 Hot water return temp | " | 290 | " | ||
| DL2-52 | appx grid A.8/4.3, FM9 | " | 100 | run cable in conduit from meter location to cable tray segment P, then along cable tray segments P, L, and K (see DWG E2 markup) to terminus of segment K in LP office | ||
| DL2-53 | appx grid A.8/4.3, FM9 Hot water supply temp | " | 100 | " | ||
| DL2-54 | appx grid A.8/4.3, FM9 Hot water return temp | " | 100 | " | ||
| DL2-55 | appx grid A.5/3.7, FM18 | " | 200 | run cable along cable tray segments O, P, L, & K (see DWG E2 markup) to terminus of segment K in LP office | ||
| DL2-56 | appx grid A.5/3.7, FM18 Hot water supply temp | " | 200 | " | ||
| DL2-57 | appx grid A.5/3.7, FM18 Hot water return temp | " | 200 | " | ||
| DL2-58 | appx grid A.4/4.5, RH sensor for station TH-1 | " | 10 | run cable in conduit from meter location to terminus at data logger 2 location in LP office | ||
| DL2-59 | appx grid B.1/4.5, RH sensor for station TH-2 | " | 100 | run cable along cable tray segments I, L, & K (see DWG E2 markup) to terminus of segment K above LP office | ||
| DL2-60 | appx grid D/9, RH sensor for station TH-3 | " | 385 | run cable in conduit from meter location to cable tray segment M, then along cable tray segments M and K (see DWG E2 markup) to terminus of segment K in LP office | ||
| DL2-61 | appx grid B.4/7.4, clerestory area light meter | " | 250 | " | ||
| DL2-62 | appx grid A.4/9, GM vestibule area light meter | " | 350 | " | ||
| DL2-63 | appx grid A.6/13.5, garden center area light meter | " | 510 | " | ||
| DL2-64 | appx grid A.4/4.3, grocery vestibule area light meter | " | 40 | run cable in conduit from meter location to terminus at data logger 2 location in LP office | ||
| DL2-65 | appx grid A.4/4.5, temp sensor 1 for station TH-1 | " | 10 | " | ||
| DL2-66 | appx grid A.4/4.5, temp sensor 2 for station TH-1 | " | 10 | " | ||
| DL2-67 | appx grid A.4/4.5, temp sensor 3 for station TH-1 | " | 10 | " | ||
| DL2-68 | appx grid A.4/4.5, temp sensor 4 for station TH-1 | " | 10 | " | ||
| DL2-69 | appx grid A.4/4.5, temp sensor 5 for station TH-1 | " | 10 | " | ||
| DL2-70 | appx grid B.1/4.5, temp sensor 1 for station TH-2 | " | 100 | run cable along cable tray segments I, L, & K (see DWG E2 markup) to terminus of segment K in LP office | ||
| DL2-71 | appx grid B.1/4.5, temp sensor 2 for station TH-2 | " | 100 | " | ||
| DL2-72 | appx grid B.1/4.5, temp sensor 3 for station TH-2 | " | 100 | " | ||
| DL2-73 | appx grid B.1/4.5, temp sensor 4 for station TH-2 | " | 100 | " | ||
| DL2-74 | appx grid B.1/4.5, temp sensor 5 for station TH-2 | " | 100 | " | ||
| DL2-75 | appx grid D/9, temp sensor 1 for station TH- 3 | " | 385 | run cable in conduit from meter location to cable tray segment M, then along cable tray segments M and K (see DWG E2 markup) to terminus of segment K in LP office | ||
| DL2-76 | appx grid D/9, temp sensor 2 for station TH- 3 | " | 385 | " | ||
| DL2-77 | appx grid D/9, temp sensor 3 for station TH- 3 | " | 385 | " | ||
| DL2-78 | appx grid D/9, temp sensor 4 for station TH- 3 | " | 385 | " | ||
| DL2-79 | appx grid D/9, temp sensor 5 for station TH- 3 | " | 385 | " | ||
| total estimated cable run length | 9845 | 6335 | 2475 | |||
| total excess per NOTE 4 | 1750 | 1450 | 750 | |||
| total estimated cable required (ft) | 11595 | 7785 | 3225 |
Notes:
- Please leave at least 25 ft of excess at both ends of each cable for ORNL use in making final connections to instruments and data logger
- Please clearly label cables at each end with cable number
- Where conduit is used to carry cables to nearest cable tray, make sure conduit is securely attached to ceiling structural members and/or wall and is of a color that will blend in with surroundings. Conduit may be rigid or flexible type and may be of metal or PVC material.
- Re DL1-67: The plan is to work with the gas utility to get a pulse output added to the utility meter, run the signal wire into the TLE mech room (hopefully through an existing penetration), and connect that to the extension cable coming from cable tray A
- Cable shall have one shielded pair of AWG 20 or larger with ground wire
- Cable shall have two shielded pairs of AWG 20 or larger with ground wire
- Shall be Omega type EXPP-T-20 or equal
- Please leave at least 25 ft of excess at both ends of each cable for ORNL use in making final connections to instruments and data logger
- Please clearly label cables at each end with cable number
- Where conduit is used to carry cables to nearest cable tray, make sure conduit is securely attached to ceiling structural members and/or wall and is of a color that will blend in with surroundings. Conduit may be rigid or flexible type and may be of metal or PVC material.
Cable Layout Drawing, #206 E2 Markup
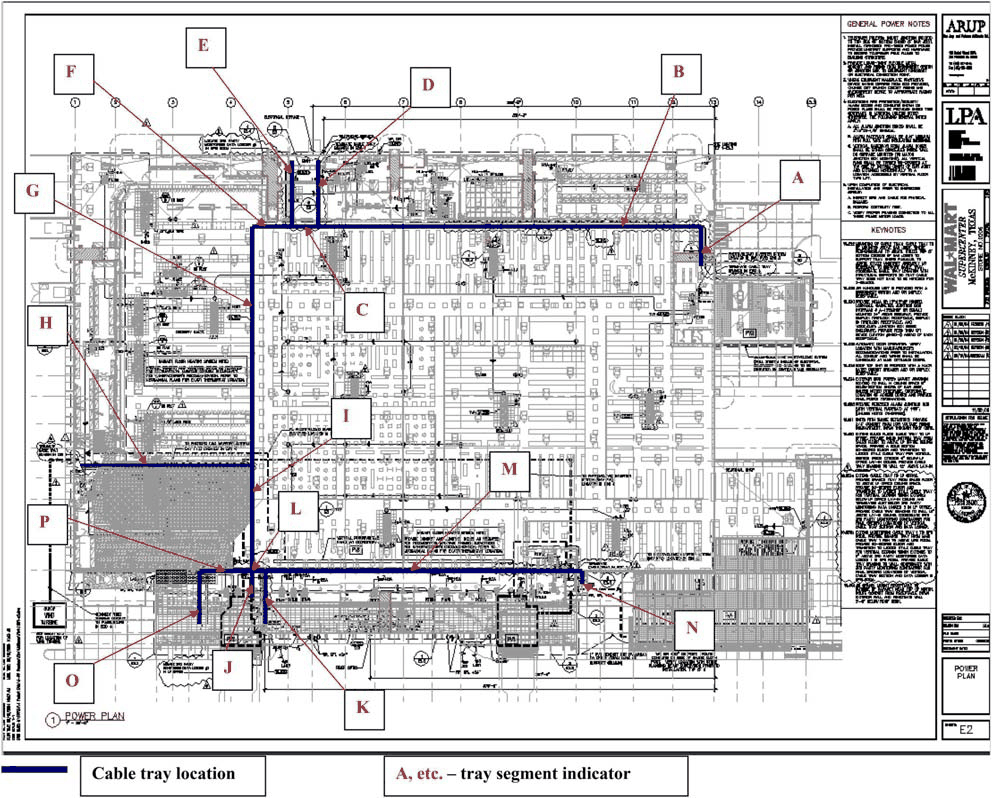
Monitoring instrumentation cable and device listing — McKinney Store 5211
Cable numbers are prefixed 5211-01. A quotation mark (") in a cell repeats the entry in the row above.
Data Logger 1 (nominal — Energy ICT used their own loggers)
| Cable number (Note 5) | Starting point | Termination point | 2-wire shielded cable, estimated run length (ft) (Notes 1 & 4) | 4-wire shielded cable, estimated run length (ft) (Notes 2 & 4) | Type T thermocouple extension cable, estimated run length (ft) (Notes 3 & 4) | Installation comments |
|---|---|---|---|---|---|---|
| DL1-1 | EDC1, meter EM1; NOTE 8 | data logger 1 located in EDC1 below terminus of cable tray segment J (see DWG E2 markup) | 50.00 | run cable in conduit from meter location in EDC 1 to logger 1 location | ||
| DL1-2 | EDC1, meter EM2 | " | 50.00 | " | ||
| DL1-3 | EDC1, meter EM3 | " | 50.00 | " | ||
| DL1-4 | EDC1, meter EM4 | " | 50.00 | " | ||
| DL1-5 | EDC1, meter EM5 | " | 50.00 | " | ||
| DL1-6 | EDC1, meter EM6 | " | 50.00 | " | ||
| DL1-7 | EDC1, meter EM7 | " | 50.00 | " | ||
| DL1-8 | EDC1, meter EM11 | " | 50.00 | " | ||
| DL1-9 | EDC1, meter EM12 | " | 50.00 | " | ||
| DL1-10 | EDC1, meter EM14 | " | 50.00 | " | ||
| DL1-11 | EDC1, meter EM15 | " | 50.00 | " | ||
| DL1-12 | EDC1, meter EM35 | " | 50.00 | " | ||
| DL1-13 | appx grid D.5/2.4, RH sensor for station TH-4 | " | 340.00 | run cable in conduit from meter location to cable tray segment D (existing), then along cable tray segments D, E, and J (new) to logger 1 location | ||
| DL1-14 | appx grid H/4, RH sensor for station TH-5 | " | 120.00 | " | ||
| DL1-15 | appx grid F/4, RH sensor for station TH-6 | " | 220.00 | " | ||
| DL1-16 | appx grid D.5/2.4, temp sensor 1 for station TH-4 | " | 340.00 | " | ||
| DL1-17 | appx grid D.5/2.4, temp sensor 2 for station TH-4 | " | 340.00 | " | ||
| DL1-18 | appx grid D.5/2.4, temp sensor 3 for station TH-4 | " | 340.00 | " | ||
| DL1-19 | appx grid D.5/2.4, temp sensor 4 for station TH-4 | " | 340.00 | " | ||
| DL1-20 | appx grid D.5/2.4, temp sensor 5 for station TH-4 | " | 340.00 | " | ||
| DL1-21 | appx grid H/4, temp sensor 1 for station TH-5 | " | 120.00 | " | ||
| DL1-22 | appx grid H/4, temp sensor 2 for station TH-5 | " | 120.00 | " | ||
| DL1-23 | appx grid H/4, temp sensor 3 for station TH-5 | " | 120.00 | " | ||
| DL1-24 | appx grid H/4, temp sensor 4 for station TH-5 | " | 120.00 | " | ||
| DL1-25 | appx grid H/4, temp sensor 5 for station TH-5 | " | 120.00 | " | ||
| DL1-26 | appx grid F/4, temp sensor 1 for station TH-6 | " | 220.00 | " | ||
| DL1-27 | appx grid F/4, temp sensor 2 for station TH-6 | " | 220.00 | " | ||
| DL1-28 | appx grid F/4, temp sensor 3 for station TH-6 | " | 220.00 | " | ||
| DL1-29 | appx grid F/4, temp sensor 4 for station TH-6 | " | 220.00 | " | ||
| DL1-30 | appx grid F/4, temp sensor 5 for station TH-6 | " | 220.00 | " | ||
| DL1-31 | weather station, wind speed | " | cable to be ordered to length with weather station | |||
| DL1-32 | weather station, wind direction | " | " | |||
| DL1-33 | weather station, air temperature | " | " | |||
| DL1-34 | weather station, dew point temperature (or RH) | " | " | |||
| DL1-35 | weather station, rain gauge | " | " | |||
| DL1-36 | weather station, solar radiation horizontal | " | " | |||
| DL1-37 | weather station, barometric pressure | " | " | |||
| DL1-38 | weather station, light meter | " | " | |||
| DL2-1 | EDC2, meter EM8; NOTE 8 | data logger 2 located in EDC2 below terminus of cable tray segment G (see DWG E2 markup) | 25.00 | run cable from meter location in EDC2 to logger 2 location | ||
| DL2-2 | EDC2, meter | " | 25.00 | " | ||
| total estimated cable run length | 600.00 | 680.00 | 3400.00 | |||
| total excess per NOTE 4 | 300.00 | 150.00 | 750.00 | |||
| total estimated cable required (ft) | 900.00 | 830.00 | 4150.00 |
Notes:
- Cable shall have one shielded pair of AWG 20 or larger with ground wire
- Cable shall have two shielded pairs of AWG 20 or larger with ground wire
- Shall be Omega type EXPP-T-20 or equal
- For the cables going to the electric meters located in EDC1 (cables DL1-1 thru DL1-12), please connect cable to the +&- output terminals (black or red on + terminal, white on - terminal) on the WattNode meter and leave 25 ft excess at the data logger end for ORNL use in connecting cable to data logger. For all other cables, please leave at least 25 ft of excess at both ends of each cable for ORNL use in making final connections to instruments and data logger.
- Please clearly label cables at each end with cable number
- Where conduit is used to carry cables to nearest cable tray, make sure conduit is securely attached to ceiling structural members and/or wall and is of a color that will blend in with surroundings. Conduit may be rigid or flexible type and may be of metal or PVC material.
- Please be prepared to provide a licensed electrician onsite to assist ORNL in making meter connections and/or trouble shooting electric meter installations as required. Estimate up to two weeks (80 hrs) maximum electrician assistance required.
- contractor to purchase and install electric meters in EDC1 and corresponding CTs
General four new segments to be added to existing cable tray (see DWG E2 markup) segment G - from terminus of existing segment A to EDC2 (data logger 2 location) (OK to use conduit instead of cable tray) segment H - from existing segments C&D to EDC4 segment I - from new segment H at ceiling to appx grid point E/1 (just inside wall opposite compressor houses) segment J - from existing segments E&F to EDC1 (data logger 1 location)
Data Logger 2 (nominal — Energy ICT used their own loggers)
| Cable number (Note 5) | Starting point | Termination point | 2-wire shielded cable, estimated run length (ft) (Notes 1 & 4) | 4-wire shielded cable, estimated run length (ft) (Notes 2 & 4) | Type T thermocouple extension cable, estimated run length (ft) (Notes 3 & 4) | Installation comments |
|---|---|---|---|---|---|---|
| DL2-1 | EDC2, meter EM8; NOTE 8 | data logger 2 located in EDC2 below terminus of cable tray segment G (see DWG E2 markup) | 25.00 | run cable from meter location in EDC2 to logger 2 location | ||
| DL2-2 | EDC2, meter EM9 | " | 25.00 | " | ||
| DL2-3 | EDC2, meter EM29 | " | 25.00 | " | ||
| DL2-4 | EDC2, meter EM31 | " | 25.00 | " | ||
| DL2-5 | EDC2, meter EM32 | " | 25.00 | " | ||
| DL2-6 | EDC2, meter EM33 | " | 25.00 | " | ||
| DL2-7 | EDC2, meter EM34 | " | 25.00 | " | ||
| DL2-8 | EDC2, meter EM36 | " | 25.00 | " | ||
| DL2-9 | EDC4, meter EM10 | " | 500.00 | run cable from meter location in EDC4 along cable tray segments H (new), C, A, & G (new) to logger 2 location in EDC2 | ||
| DL2-10 | EDC4, meter EM13 | " | 500.00 | " | ||
| DL2-11 | EDC4, meter EM30 | " | 500.00 | " | ||
| DL2-12 | compressor house1, meter EM16 | " | 640.00 | run cable in conduit from meter location in compressor house electric panels to terminus of new tray segment I inside building (new penetra-tion of wall if necessary); then run cable along tray segments I, H, C, A & G to logger 2 location in EDC2 | ||
| DL2-13 | compressor house1, meter EM17 | " | 640.00 | " | ||
| DL2-14 | compressor house1, meter EM18 | " | 640.00 | " | ||
| DL2-15 | compressor house1, meter EM21 | " | 640.00 | " | ||
| DL2-16 | compressor house1, meter EM22 | " | 640.00 | " | ||
| DL2-17 | compressor house1, meter EM23 | " | 640.00 | " | ||
| DL2-18 | compressor house1, meter EM24 | " | 640.00 | " | ||
| DL2-19 | compressor house2, meter EM19 | " | 640.00 | " | ||
| DL2-20 | compressor house2, meter EM20 | " | 640.00 | " | ||
| DL2-21 | compressor house2, meter EM25 | " | 640.00 | " | ||
| DL2-22 | compressor house2, meter EM26 | " | 640.00 | " | ||
| DL2-23 | compressor house2, meter EM27 | " | 640.00 | " | ||
| DL2-24 | compressor house2, meter EM28 | " | 640.00 | " | ||
| DL2-25 | appx grid A.4/4.5, RH sensor for station TH-1 | " | 320.00 | run cable in conduit from meter location to terminus of cable tray segment B above LP office ceiling, then along segments B, A & G to logger 2 location in EDC2 | ||
| DL2-26 | appx grid B.1/4.5, RH sensor for station TH-2 | " | 305.00 | run cable from meter location along cable tray segments C, A & G (see DWG E2 markup) to logger 2 location EDC2 | ||
| DL2-27 | appx grid D/9, RH sensor for station TH-3 | " | 175.00 | run cable in conduit from meter location to new cable tray segment G, then along segment G to logger 2 location in EDC2 | ||
| DL2-28 | appx grid C/9, general sales area light meter | " | 130.00 | " | ||
| DL2-29 | appx grid A.4/4.5, temp sensor 1 for station TH-1 | " | 320.00 | run cable in conduit from meter location to terminus of cable tray segment B above LP office ceiling, then along segments B, A & G to logger 2 location in EDC2 | ||
| DL2-30 | appx grid A.4/4.5, temp sensor 2 for station TH-1 | " | 320.00 | " | ||
| DL2-31 | appx grid A.4/4.5, temp sensor 3 for station TH-1 | " | 320.00 | " | ||
| DL2-32 | appx grid A.4/4.5, temp sensor 4 for station TH-1 | " | 320.00 | " | ||
| DL2-33 | appx grid A.4/4.5, temp sensor 5 for station TH-1 | " | 320.00 | " | ||
| DL2-34 | appx grid B.1/4.5, temp sensor 1 for station TH-2 | " | 305.00 | run cable along cable tray segments C, A & G (see DWG E2 markup) to logger 2 location EDC2 | ||
| DL2-35 | appx grid B.1/4.5, temp sensor 2 for station TH-2 | " | 305.00 | " | ||
| DL2-36 | appx grid B.1/4.5, temp sensor 3 for station TH-2 | " | 305.00 | " | ||
| DL2-37 | appx grid B.1/4.5, temp sensor 4 for station TH-2 | " | 305.00 | " | ||
| DL2-38 | appx grid B.1/4.5, temp sensor 5 for station TH-2 | " | 305.00 | " | ||
| DL2-39 | appx grid D/9, temp sensor 1 for station TH-3 | " | 130.00 | run cable in conduit from meter location to new cable tray segment G, then along segment G to logger 2 location in EDC2 | ||
| DL2-40 | appx grid D/9, temp sensor 2 for station TH-3 | " | 130.00 | " | ||
| DL2-41 | appx grid D/9, temp sensor 3 for station TH-3 | " | 130.00 | " | ||
| DL2-42 | appx grid D/9, temp sensor 4 for station TH-3 | " | 130.00 | " | ||
| DL2-43 | appx grid D/9, temp sensor 5 for station TH-3 | " | 130.00 | " | ||
| DL2-44 | appx grid B/3, snack bar/bakery gas meter | " cable required (ft) | 365.00 | run cable in conduit from meter location to cable tray segment C, then along cable tray segments C, A & G to logger 2 location in EDC2 | ||
| total estimated cable run length | 10385.00 | 930.00 | 3775.00 | |||
| total excess per NOTE 4 | 675.00 | 200.00 | 750.00 | |||
| total estimated | 11060.00 | 1130.00 | 4525.00 |
Notes:
- Cable shall have two shielded pairs of AWG 20 or larger with ground wire
- Shall be Omega type EXPP-T-20 or equal
- For the cables going to the electric meters located in EDC1 (cables DL1-1 thru DL1-12), please connect cable to the +&- output terminals (black or red on + terminal, white on - terminal) on the WattNode meter and leave 25 ft excess at the data logger end for ORNL use in connecting cable to data logger. For all other cables, please leave at least 25 ft of excess at both ends of each cable for ORNL use in making final connections to instruments and data logger.
- Please clearly label cables at each end with cable number
- Where conduit is used to carry cables to nearest cable tray, make sure conduit is securely attached to ceiling structural members and/or wall and is of a color that will blend in with surroundings. Conduit may be rigid or flexible type and may be of metal or PVC material.
- Please be prepared to provide a licensed electrician onsite to assist ORNL in making meter connections and/or trouble shooting electric meter installations as required. Estimate up to two weeks (80 hrs) maximum electrician assistance required.
- contractor to purchase and install electric meters in EDC1 and corresponding CTs
- Cable shall have one shielded pair of AWG 20 or larger with ground wire
- Cable shall have two shielded pairs of AWG 20 or larger with ground wire
- Shall be Omega type EXPP-T-20 or equal
- For the cables going to the electric meters located in the EDCs and compressor houses (cables DL2-1 thru DL2-24), please connect cable to the +&- output terminals (black or red on + terminal, white on - terminal) on the WattNode meter and leave 25 ft excess at the data logger end for ORNL use in connecting cable to data logger. For all other cables, please leave at least 25 ft of excess at both ends of each cable for ORNL use in making final connections to instruments and data logger.
- Please clearly label cables at each end with cable number
- Where conduit is used to carry cables to nearest cable tray, make sure conduit is securely attached to ceiling structural members and/or wall and is of a color that will blend in with surroundings. Conduit may be rigid or flexible type and may be of metal or PVC material.
- Please be prepared to provide a licensed electrician onsite to assist ORNL in making meter connections and/or trouble shooting electric meter installations as required. Estimate up to two weeks (80 hrs) maximum electrician assistance required.
- contractor to purchase and install electric meters in EDC2, EDC4, and compressor houses and corresponding CTs
General four new segments to be added to existing cable tray (see DWG E2 markup) segment G - from terminus of existing segment A to EDC2 (data logger 2 location) (OK to use conduit instead of cable tray) segment H - from existing segments C&D to EDC4 segment I - from new segment H at ceiling to appx grid point E/1 (just inside wall opposite compressor houses) segment J - from existing segments E&F to EDC1 (data logger 1 location) General four new segments to be added to existing cable tray (see DWG E2 markup) segment G - from terminus of existing segment A to EDC2 (data logger 2 location) (OK to use conduit instead of cable tray) segment H - from existing segments C&D to EDC4 segment I - from new segment H at ceiling to appx grid point E/1 (just inside wall opposite compressor houses) segment J - from existing segments E&F to EDC1 (data logger 1 location)
Cable Layout Drawing, #5211 E2 Markup
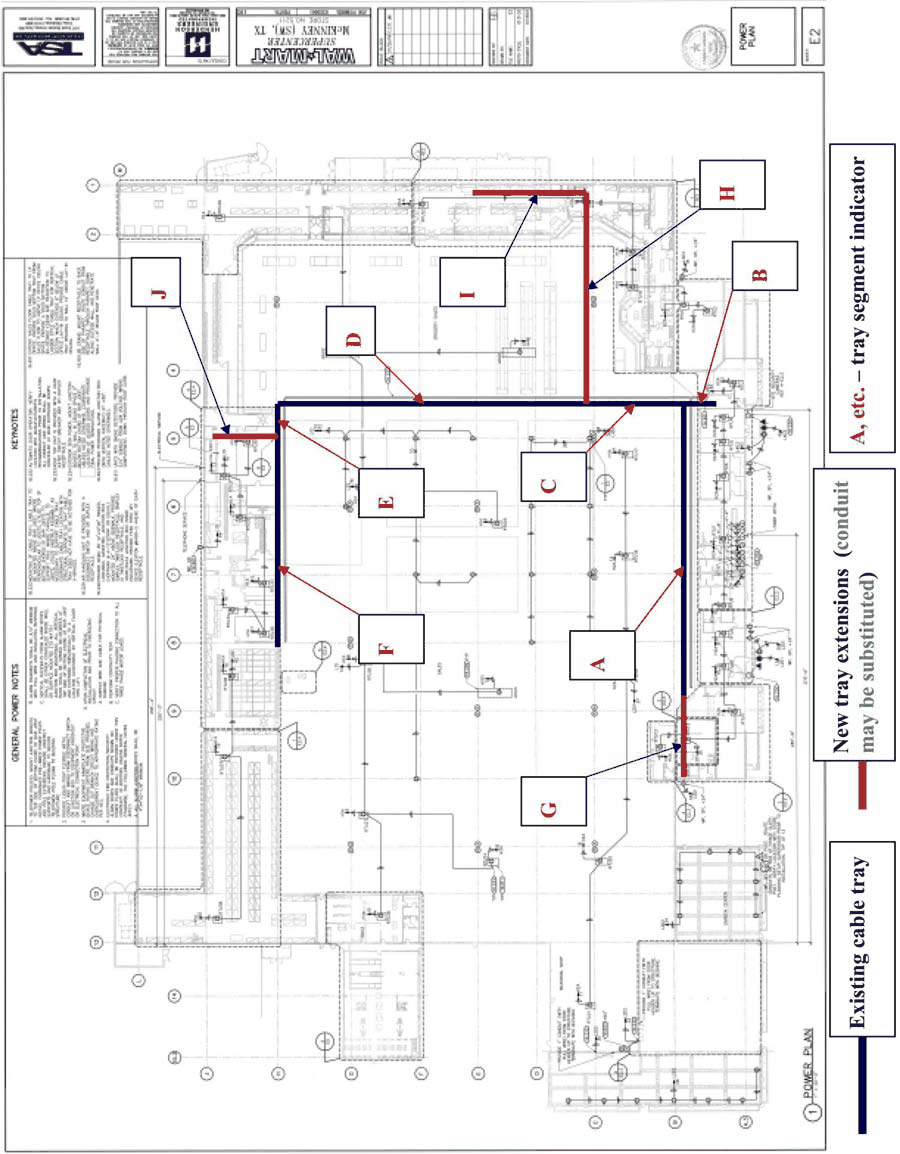
This document is a work of the U.S. government or a government-funded laboratory and is reproduced in full for research and educational purposes. Logistics Lighting has re-formatted it for readability; the wording is the original author's. Report an error at info@logisticslighting.com.
← Back to the Daylighting Library